Sep 05, 2025
5 min read
🌳 When Carbon Credits Grow on Shrubs (Part 3)
On this page
Good Friday afternoon, and welcome to your climate data briefing.
This is the third (and, for now, final) part of our mini-series on carbon credits from shrubs.
Last time, we saw that landholders, project managers, corporate emitters and governments all benefit from forest regeneration.
It left a question: does the planet win too? 🌏
It won't surprise you to read, we can't answer that fully in one sitting.
Even if you accept the underlying assumptions (e.g. that outback shrubs belong in carbon markets), there's a wilderness of detail to hack through.
This briefing looks at one issue. Let's dive into the thicket.🌵
Welcome to the Rangelands
Rangelands are vast swathes of native vegetation that cover more than half the earth's land area.
- In Australia, rangelands blanket 81% of the continent.
- It’s mostly the dry or semi-arid country we call the outback.
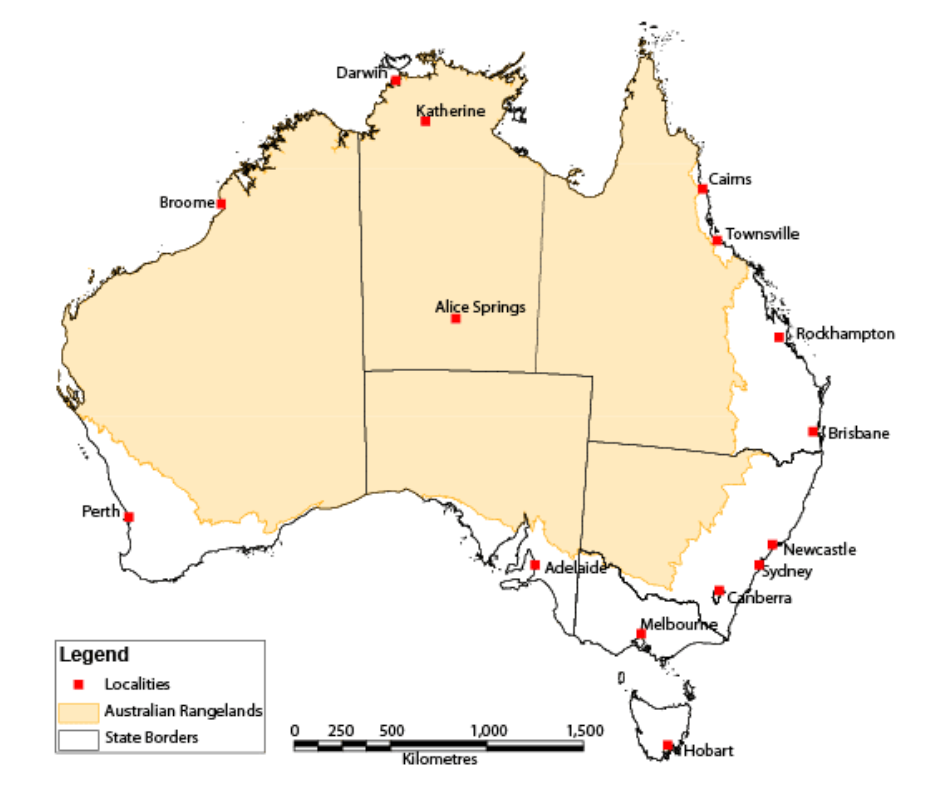
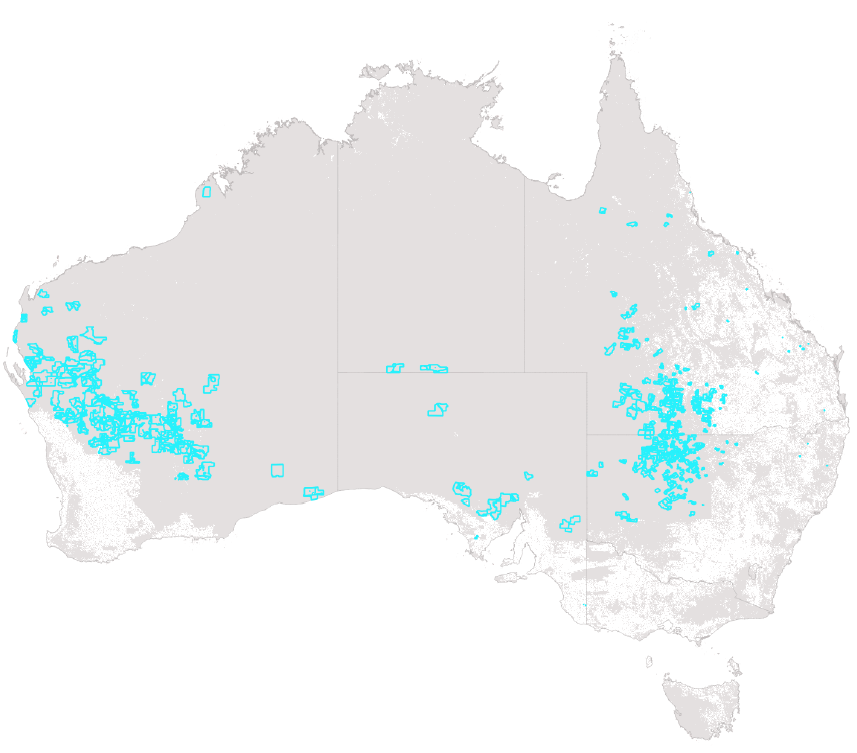
Most of Australia's carbon credit projects for human-induced regeneration of native forests are in rangelands. They cover roughly 5% of the continent (an area 20% bigger than Germany 🇩🇪).
The Measurement Question
Some researchers say the 'boom-and-bust' nature of rangelands makes them ill-suited for Human-Induced Regeneration (HIR) projects that promise to sequester carbon.
The main reasons:
- Additionality: it's hard to prove humans, not rainfall, caused growth 🙋🏼♂️
- Permanence: gains may vanish in the next drought 🔓
But we're asking a prior question: how do we know growth even happened?
We saw last week that forest regeneration projects don't measure each tree. They model tree growth. In that briefing, we said the government’s computer model, FullCAM, is 'calibrated for the site'.
But that's only partly true. ❌
- Modelling relies on assumptions. In X conditions, Y happens ...
- Calibration makes sure those assumptions reflect reality 🎯
Critics argue the FullCAM model fails the calibration test. They say:
- FullCAM was calibrated on cleared or near-cleared land with little or no vegetation
- Most HIR projects are on grazed land with shrubs and trees already present
Why that matters:
- The model doesn't see pre-existing vegetation, so it assumes a fresh start growth rate
- In reality, pre-existing vegetation is competing with new plants for water and nutrients
- Result: the model risks overstating growth 📈
Evidence: ANU researchers analysed 192 projects and found most had not been comprehensively cleared. They warned of systematic over-crediting.
Big Picture
Carbon credits underpin the promise of net zero. The logic is simple: emit here, absorb there.
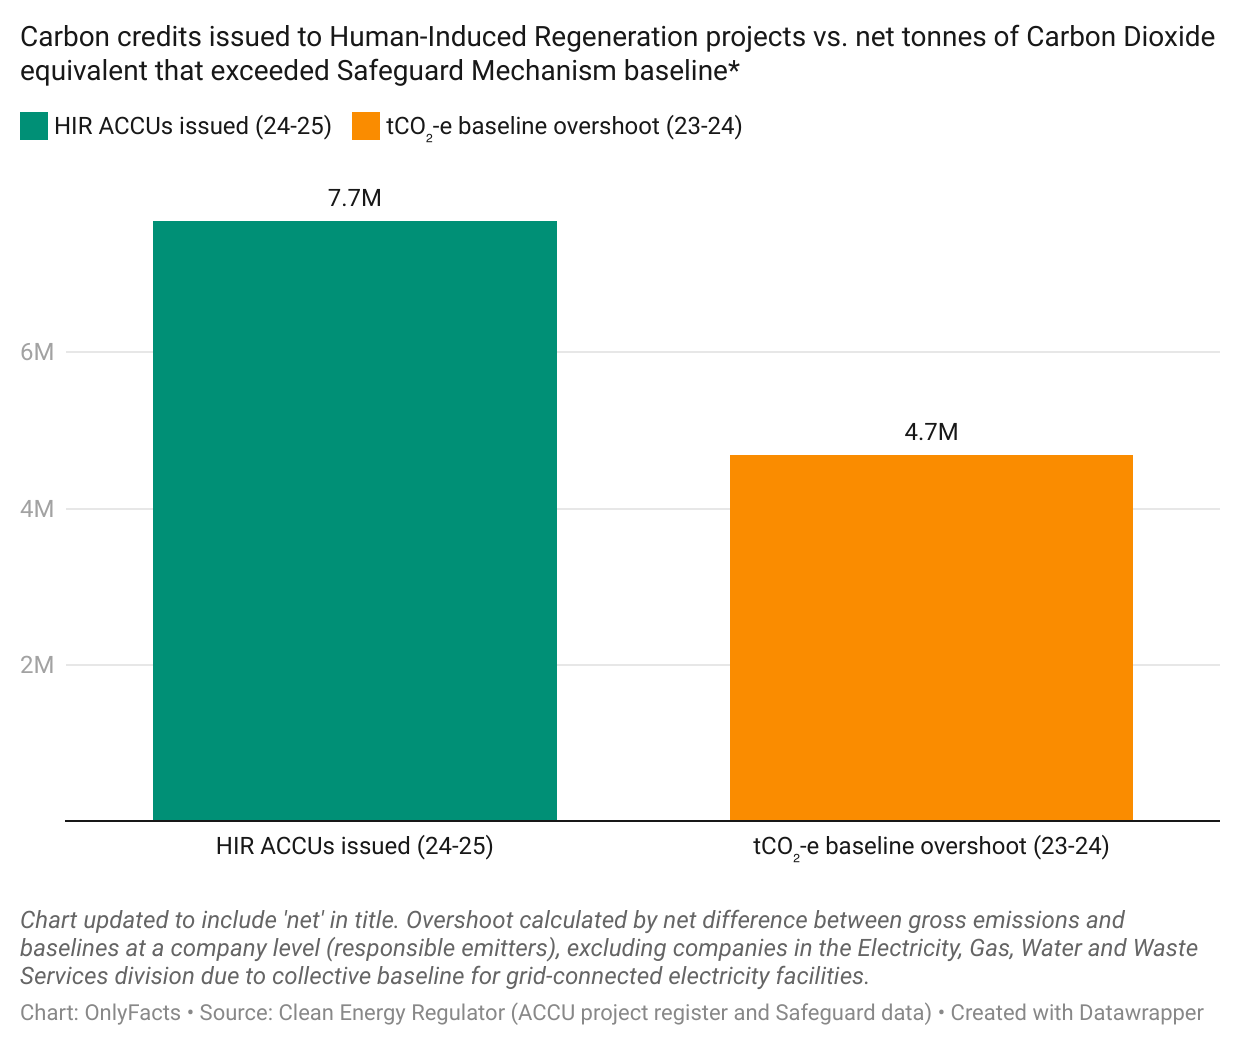
- HIR projects have delivered nearly a third of Australia’s carbon credits – more than 52 million, each considered a sequestered tonne of CO2.
- Last year, HIR credits alone covered the entire Safeguard Mechanism overshoot (the net difference between gross emissions and baselines at a company level (responsible emitters), excluding companies in the Electricity, Gas, Water and Waste Services division due to collective baseline for grid-connected electricity facilities).
That means on paper, HIR credits wipe out every tonne of excess emissions from Australia's biggest polluters.
Official Responses
The government and regulator responded to this concern (among others) in a few ways:
📐 A new model: FullCAM 2020 was developed, which included a calibration tailored to regenerating native vegetation (although most projects still use the old models).
🧐 Committee Review: the offsets assurance committee issued a report, finding:
- there was no evidence of systemic over-crediting
- pre-existing vegetation is subtracted from growth calculations
- the scheme’s general conservativism buffers against risk
🧐🧐 Chubb Review: an independent review into carbon credits (the Chubb review) concluded FullCAM is suitable for HIR projects, provided it is ‘applied appropriately at the project level’.
Which raises the next question: is it?
What's Happened Since
In February this year, the regulator emphasised modelling is a pragmatic way to track 42 million hectares of HIR projects.

It said that while the model's accuracy isn't perfect, it is acceptable, and emphasised the scheme's safeguards:
- audits and checks make sure land is on track to become forest and cut ineligible areas
- crediting is paused if growth stalls
In June, CSIRO scientists recommended clear guardrails. The model should only be used where:
- pre-existing vegetation is less than about 5 tonnes per hectare 🌱
- the regenerating trees are younger than 25 years old 👵🏼
Beyond those, they said, overestimation risks rise.
The Upshot
Models are useful, but opaque. Outsiders (such as lowly data journalists 👩🏻💻) can't easily see or test the assumptions baked into the curve.
But here's what we can confidently say:
- The Chubb review said FullCAM is fine if 'applied appropriately'
- The CSIRO set clear limits on what appropriate is (<~5 t/ha, ≤25 years)
- Those limits have not been encoded as hard rules and an unknown share of HIR land sits outside them
If non-existent growth was awarded carbon credits that are used in the Safeguard Mechanism, it means:
- Those emissions weren't offset, and the planet lost.
- Questionable credits displaced good ones, and the planet lost twice.
Data Updates
Net emissions (12-month rolling; June vs. March)
- Australia: -2.4%
Sectors:
- Fugitive Emissions: -4.2%
- Electricity: -3.3%
- Stationary Energy: -2.5%
- Industrial Processes: -2.3%
- Agriculture: -0.4%
- Transport: -0.2%
- Waste: 0%
- Land Use: 0%
💡 We'll look at this next week.
Data Blurbs
Unashamedly biased inclusion. A behind-the-scenes look at data visualisation's growing role in the European State of the Climate reports. Charts aren't decoration; they're the story. 'Every single datapoint has a story to tell about the planet we live on and that deserves to be told in the most compelling way.' Science is the protagonist, but data viz translates complexity into something accessible, engaging, urgent, and impossible to ignore. (Copernicus)
How to make music from rivers. Each one has its own signature, called a 'flow regime', shaped by climate, geography, and geology. In Colorado, a river has long low-flow periods in winter until snowmelt releases spring floods. In New Zealand, rivers are 'at the mercy of storms rolling in from the roaring forties'. Flow regimes can be visualised and one researcher converted them into actual music. 'Understanding these rhythms is essential for managing rivers'. (Predirections)

Final Thought
'A great company is a conspiracy to change the world.'
- Peter Thiel
That's your climate data briefing for this week. Pens down! Wishing you a great weekend.
Need trusted data and powerful stories? Our award-winning team can work with yours.
This article was updated to clarify the calcuation of Safeguard Mechanism 'overshoot'. It is the net difference between gross emissions and baselines at a company level (responsible emitters), excluding companies in the Electricity, Gas, Water and Waste Services division due to collective baseline for grid-connected electricity facilities). Drill into the data here.