On this page
Climate data can feel overwhelming. This site is designed to make it simple: you pick a topic, choose a location, and explore through charts and tables. Here’s how to get started.
Quick Start:
- Pick a Topic — choose from emissions, energy, or transport in the main menu.
- Choose a Location — use the geo-dropdown at the top right to switch between national, state, and local views.
- Explore the Data — sort tables and select catgories in charts.
- Drill through — click on hyperlinks in tables to go to full data history.
Start with a Topic. Then Select a Location.
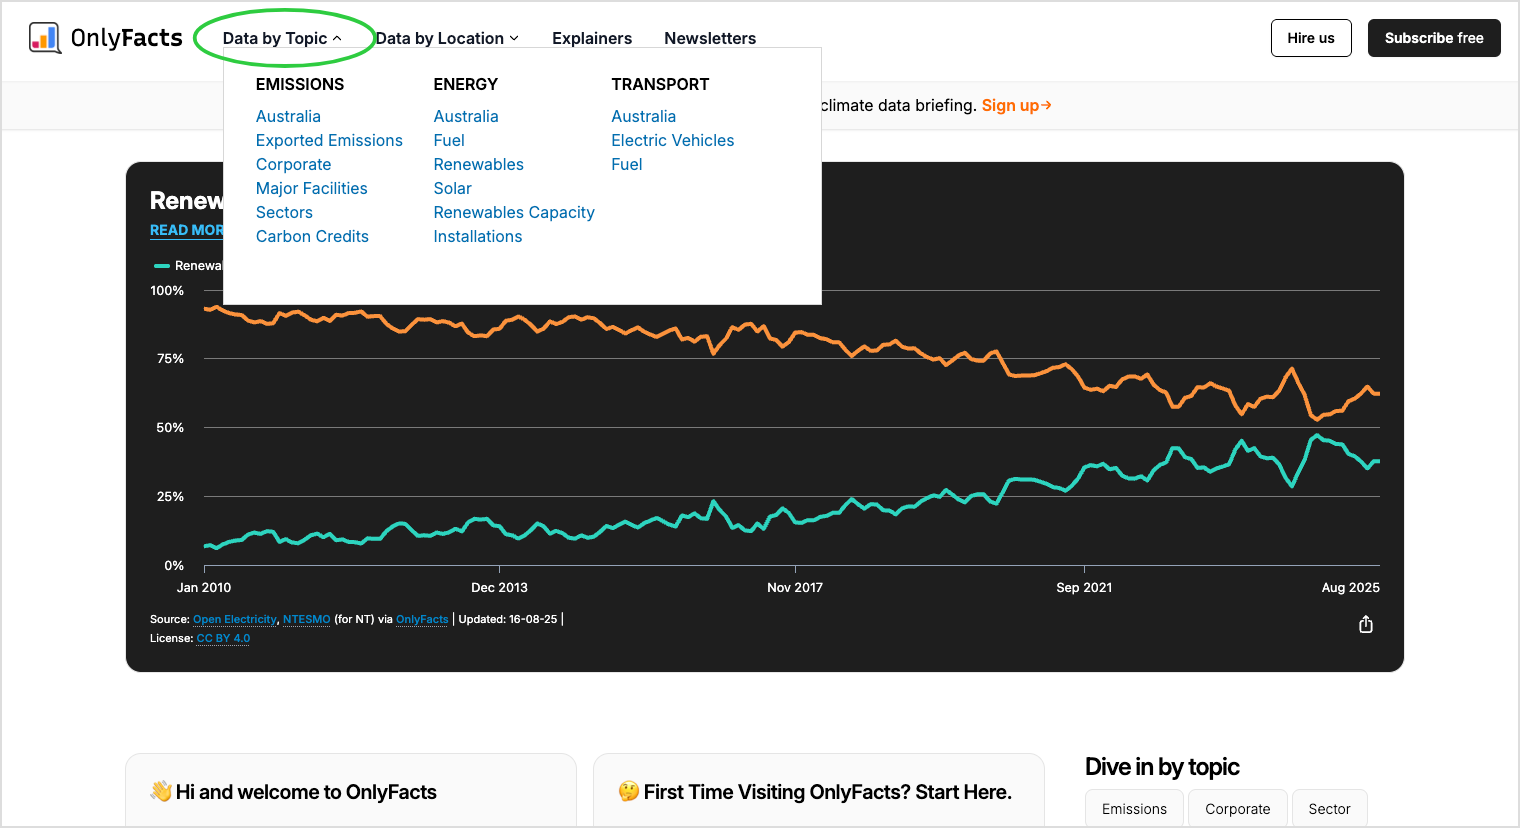
At the time of writing, OnlyFacts focuses on three topics: Emissions, Energy, and Transport. The easiest way to dive into these is through the Data by Topic link in the top navigation. This menu only shows the most popular topics. For a full list, see the dashboard index.
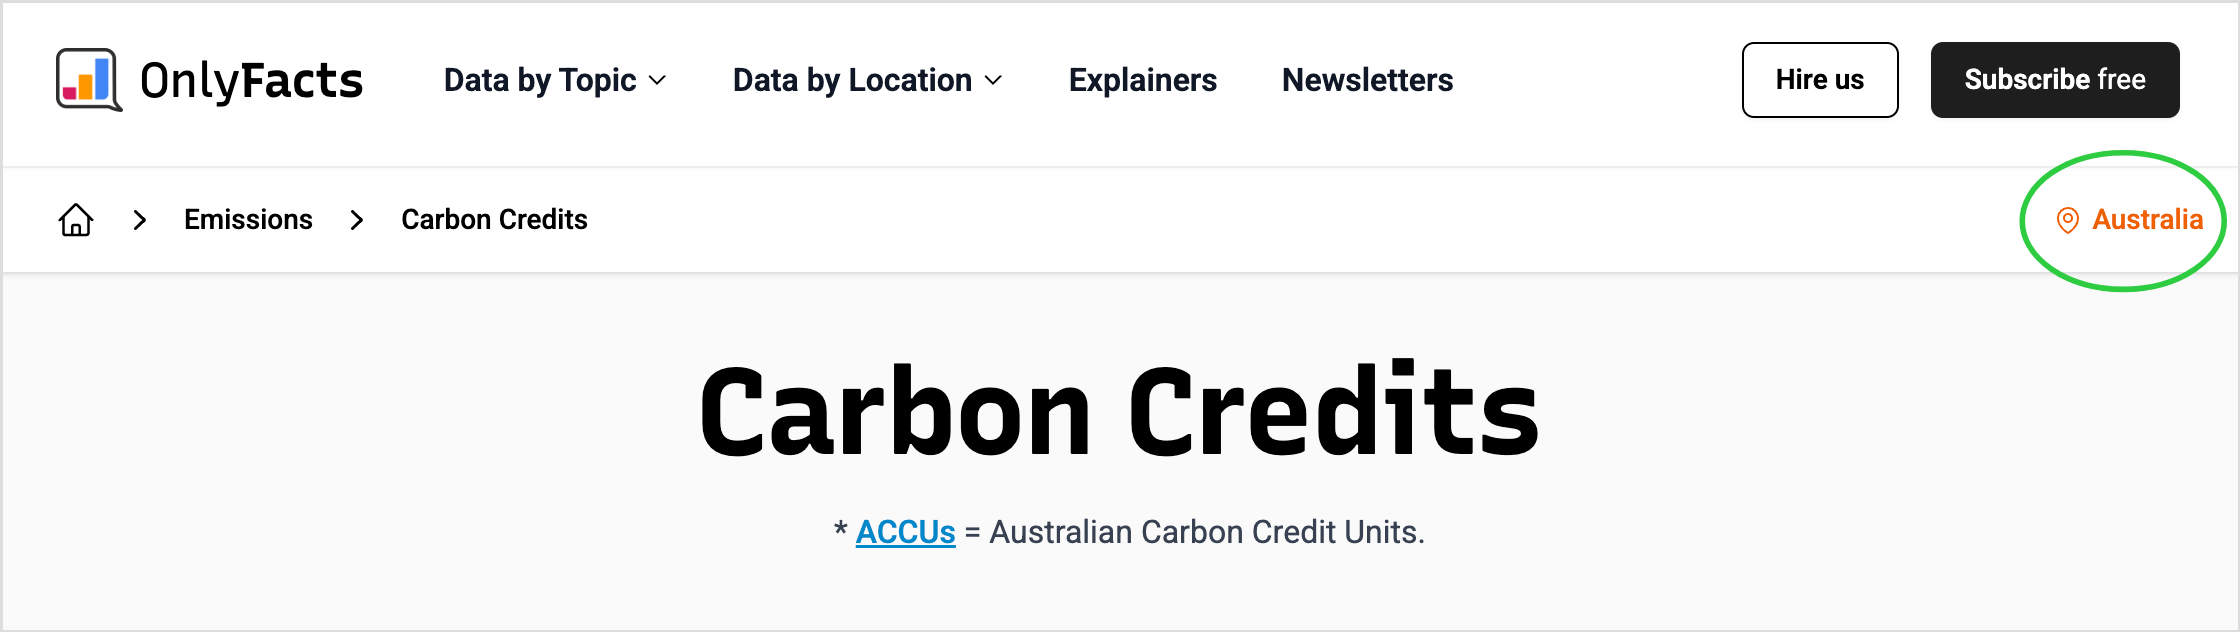
When you click on a topic, the default location will be Australia. This is shown in the top right corner.
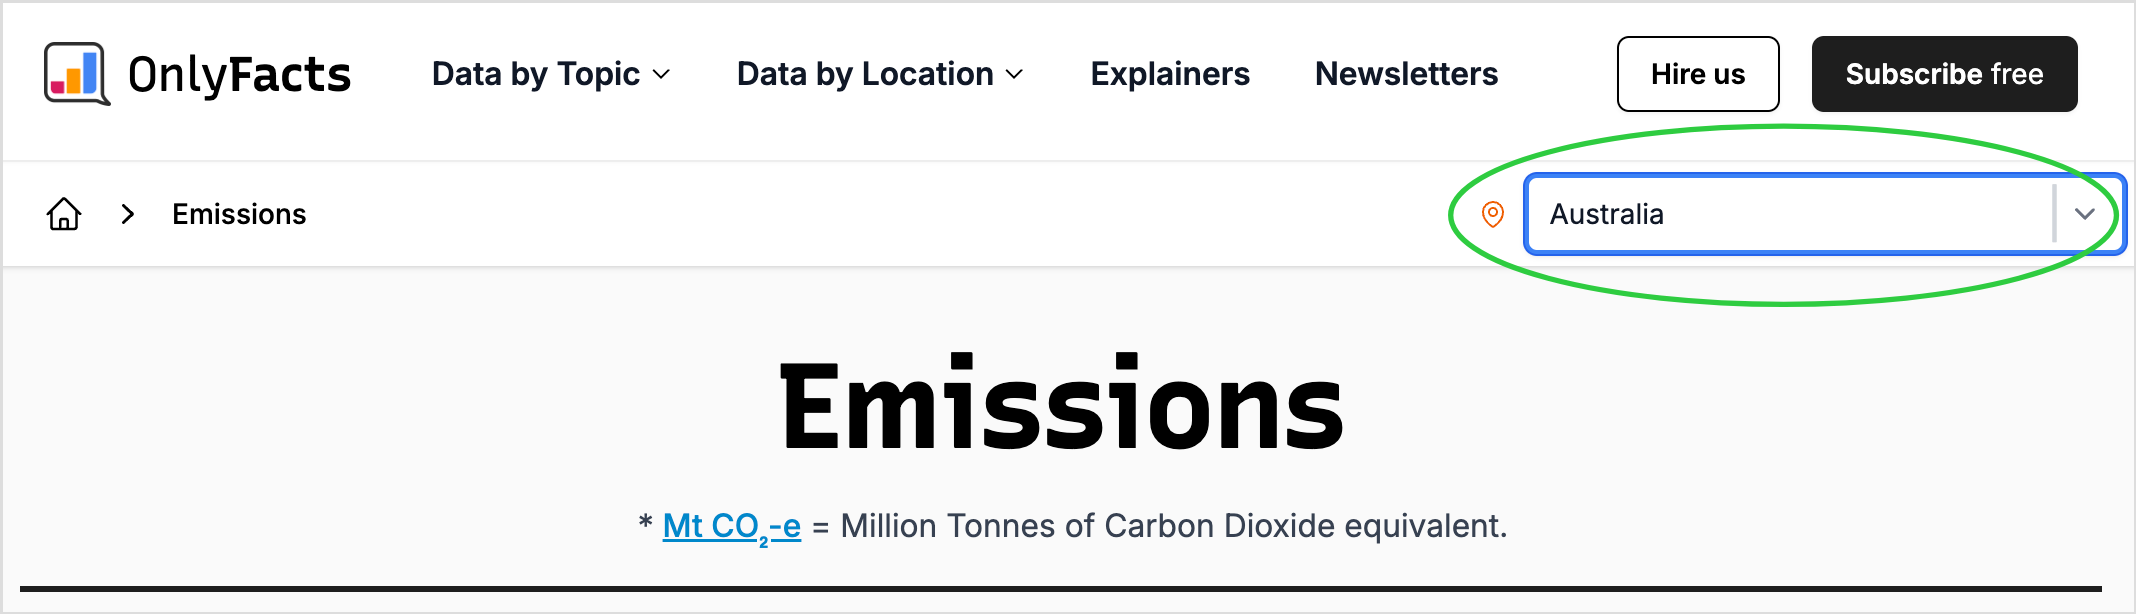
If data is available for other locations, the top-right will display as a dropdown menu.
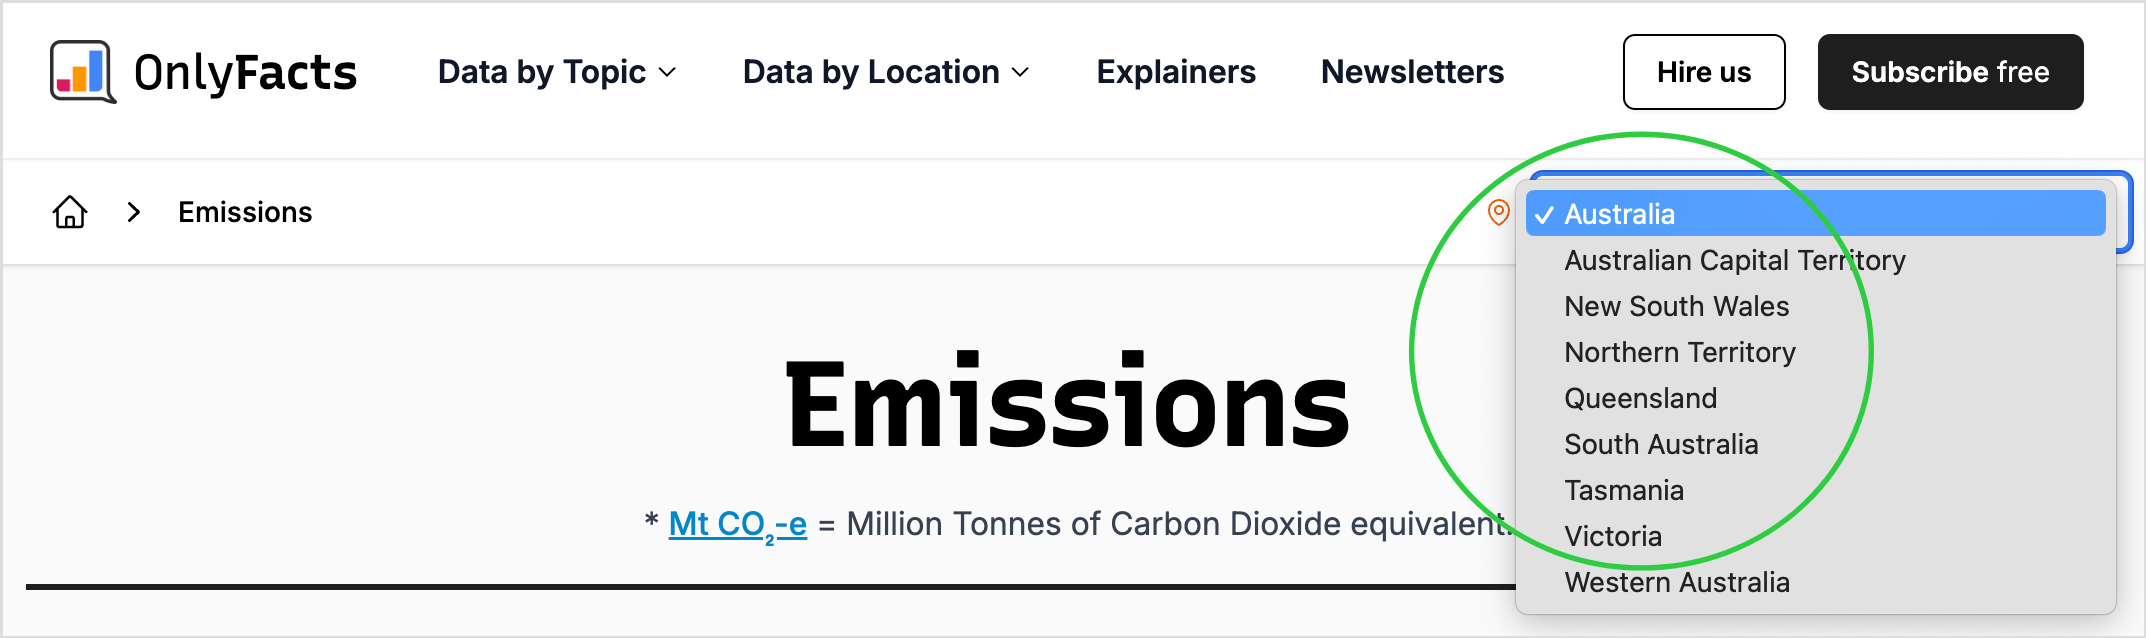
Click on the dropdown to select a different location. The options will depend on the topic, the relevant alternatives, and whether or not data exists.
Start with a Location and Choose Your Topic.
Rather than exploring the site via a topic, you can choose a location immediately. At the top of the site, select Data by Location. You'll see categories such as countries, Australia, states and territories, LGAs, and postcodes.
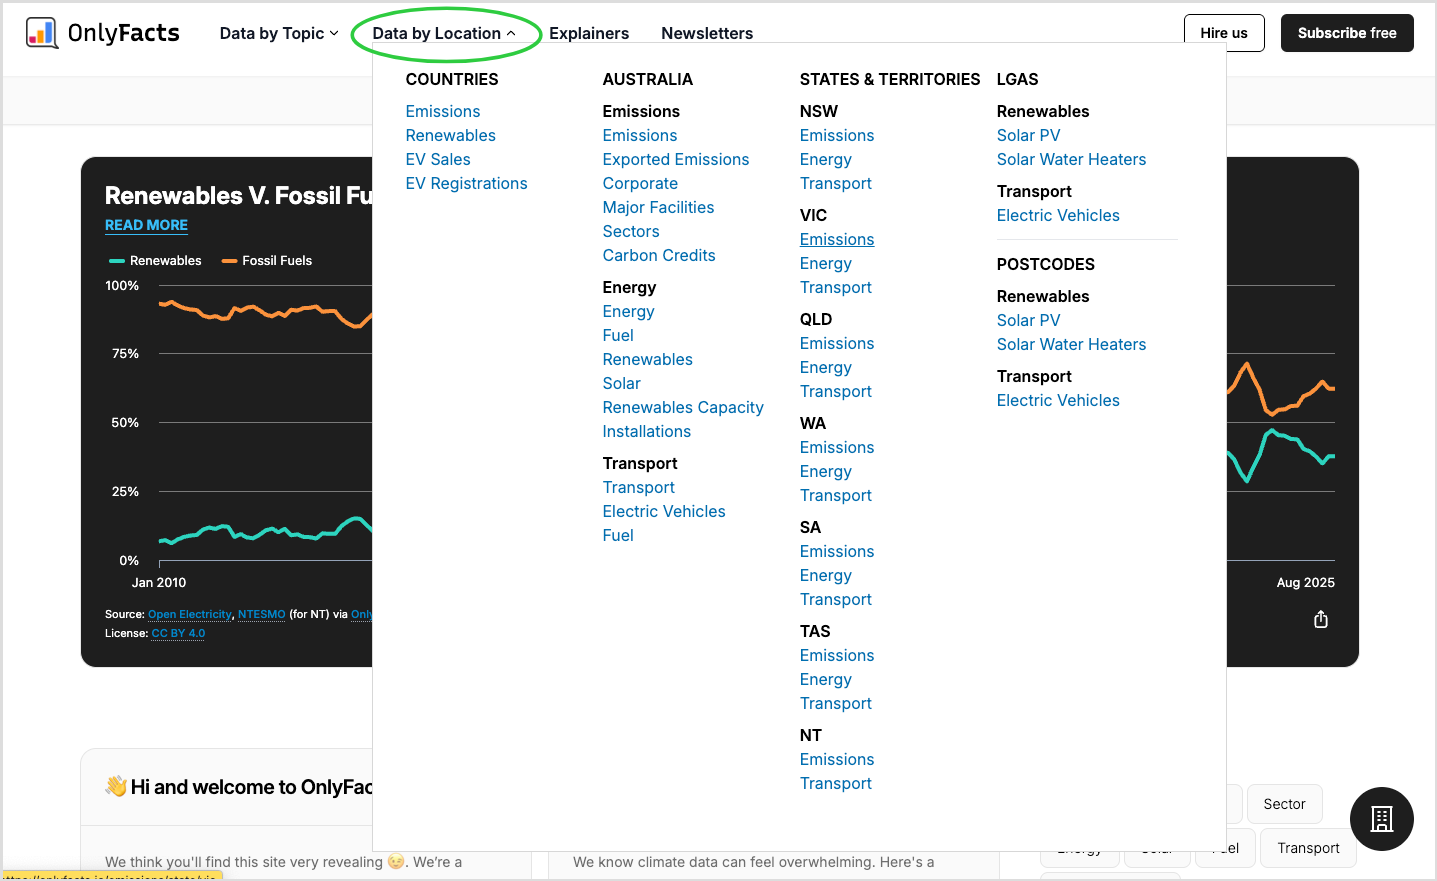
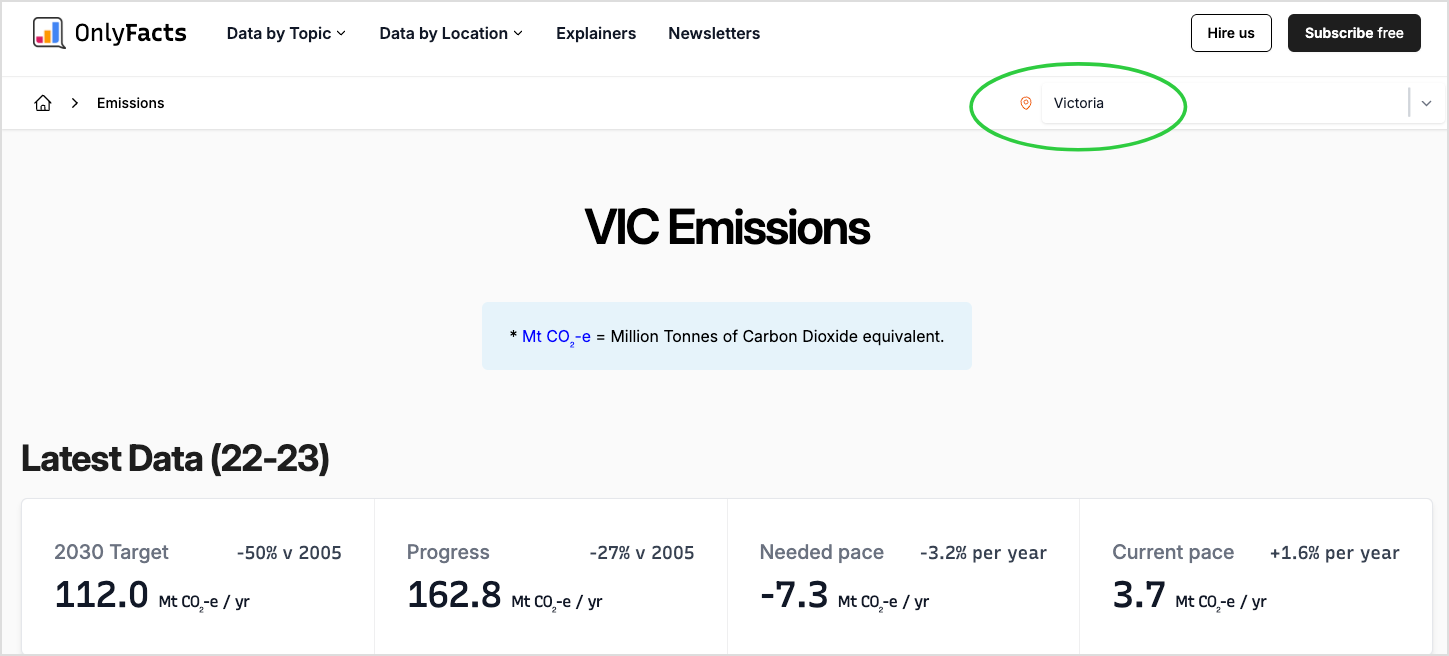
Once you make a selection, you'll see the location in the top right corner.
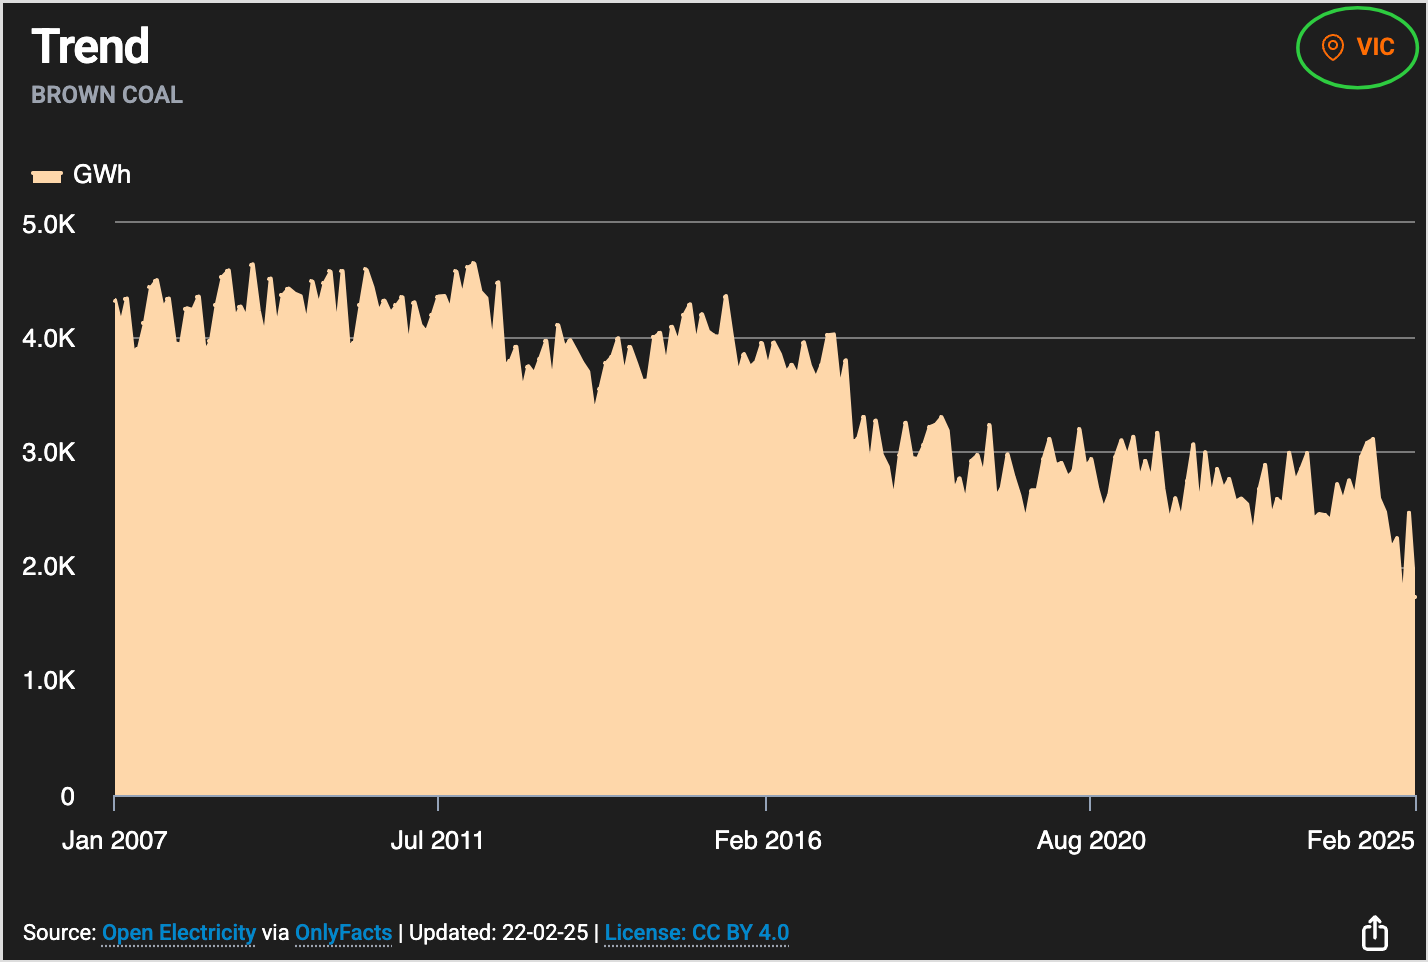
The location of each page also appears in the top right corner of each chart and table.
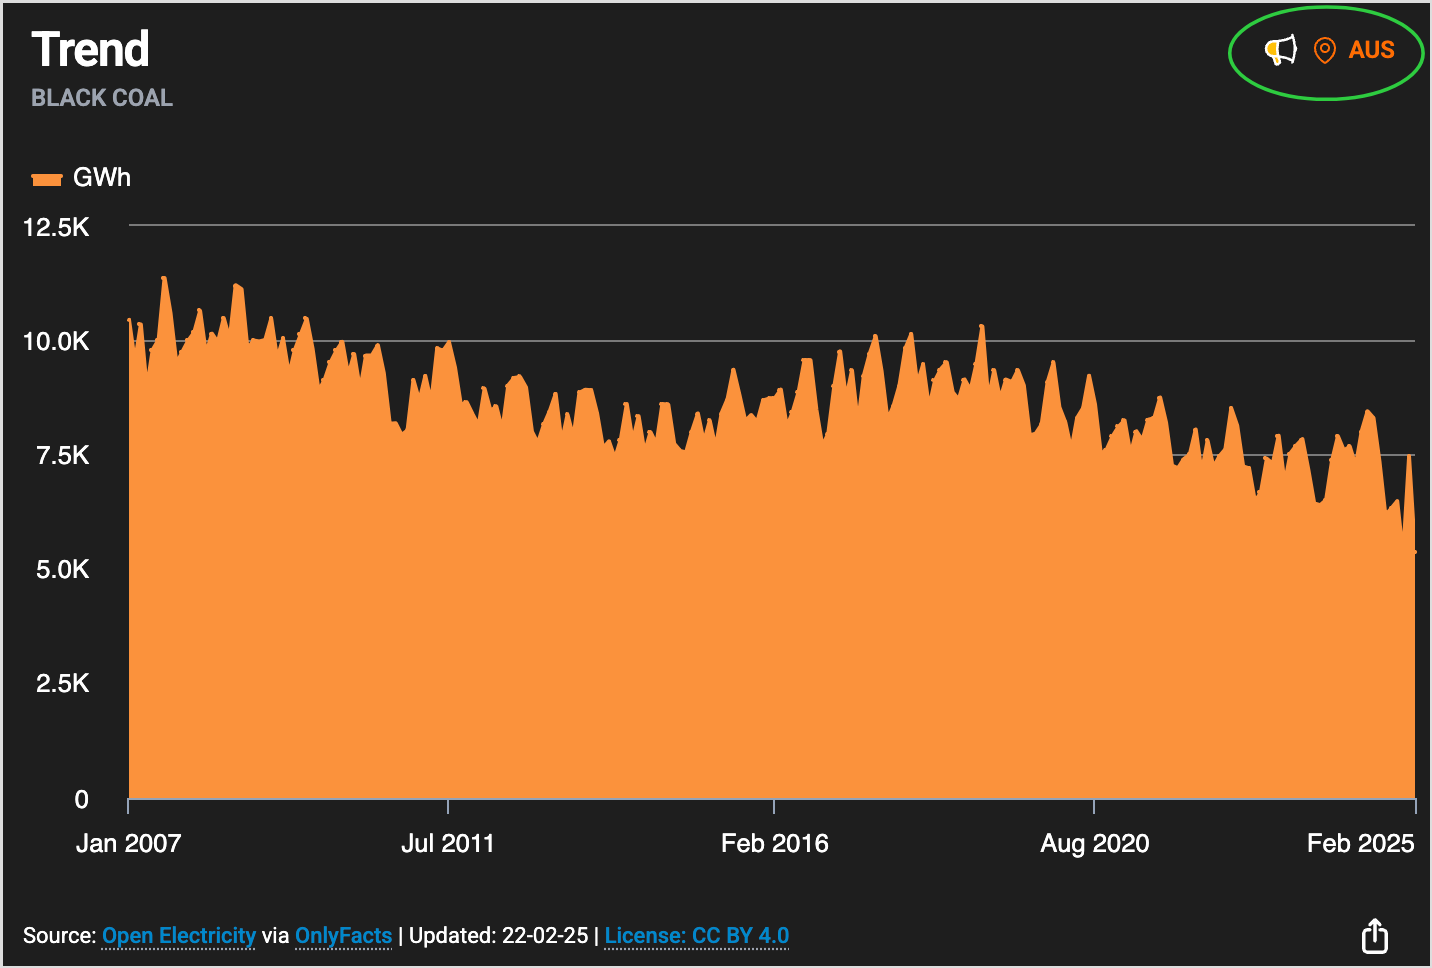
If local data isn’t available, the chart or table will display the next most detailed level, marked with an alert symbol.
Using Charts
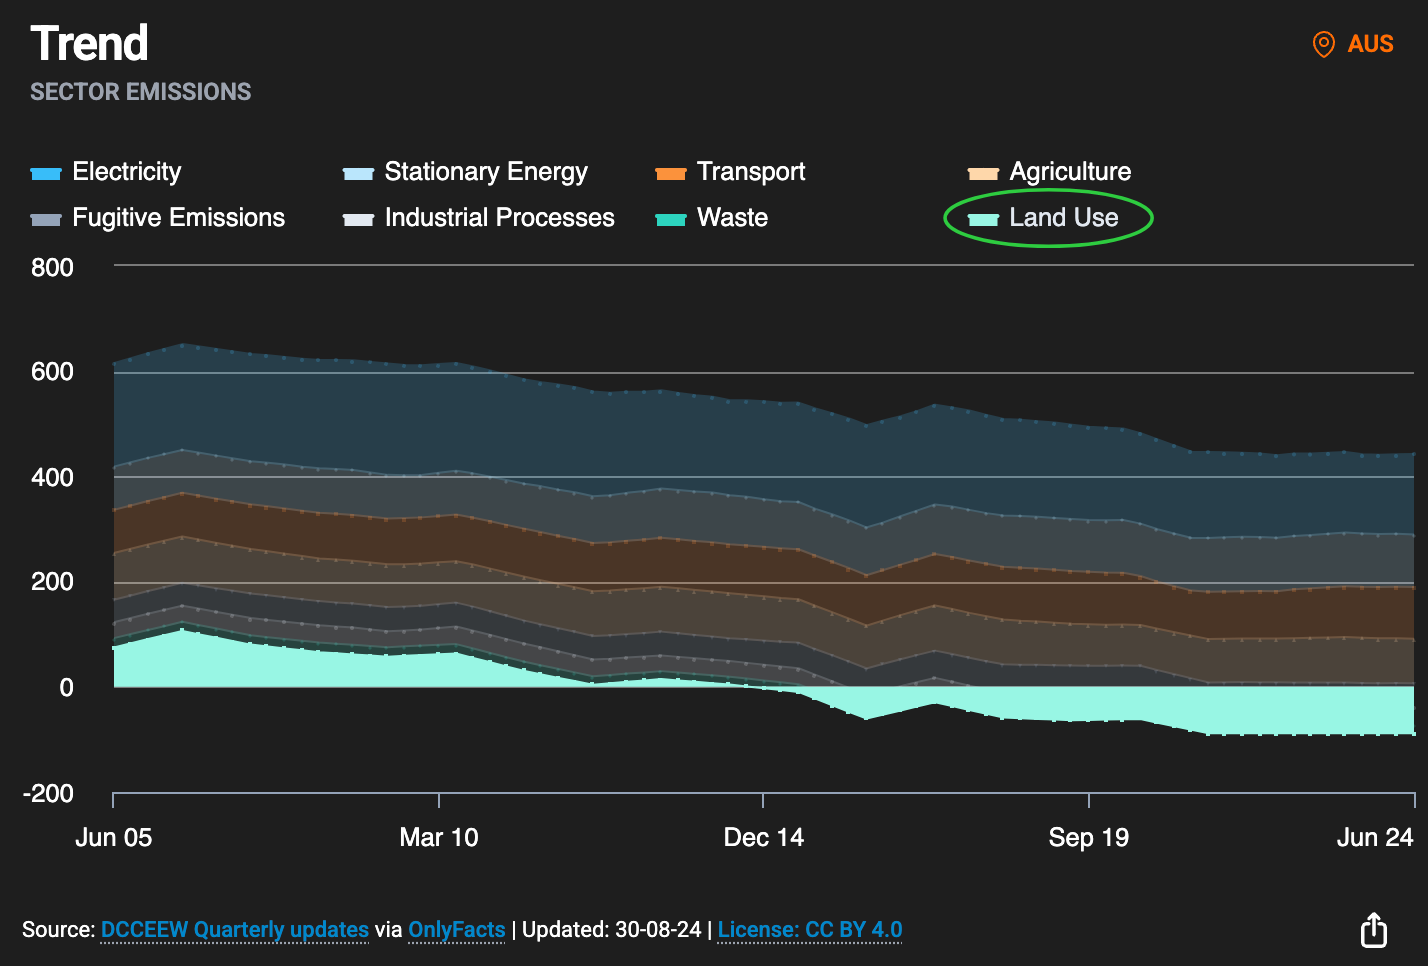
On charts, click legend items to toggle categories on and off. This makes it easier to see trends. For example, here is the chart showing Australia's emissions by sector (found here):

On desktop, hover over a category to highlight it. In the image below, Land Use is highlighted:
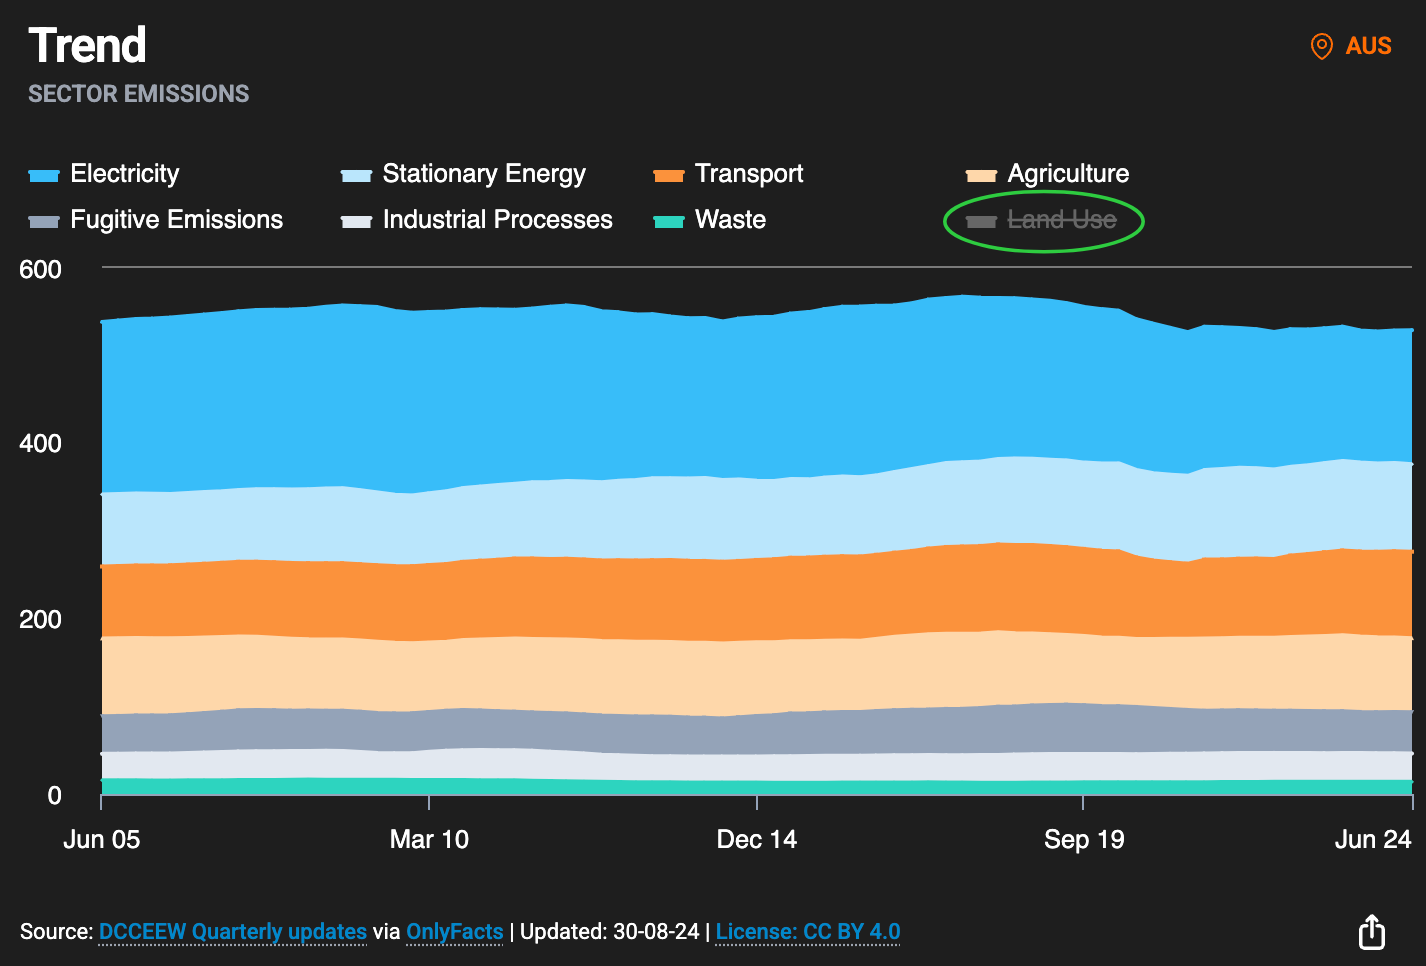
On desktop and mobile, click a category to deselect it. In the image below, Land Use is deselected.
Using Lists
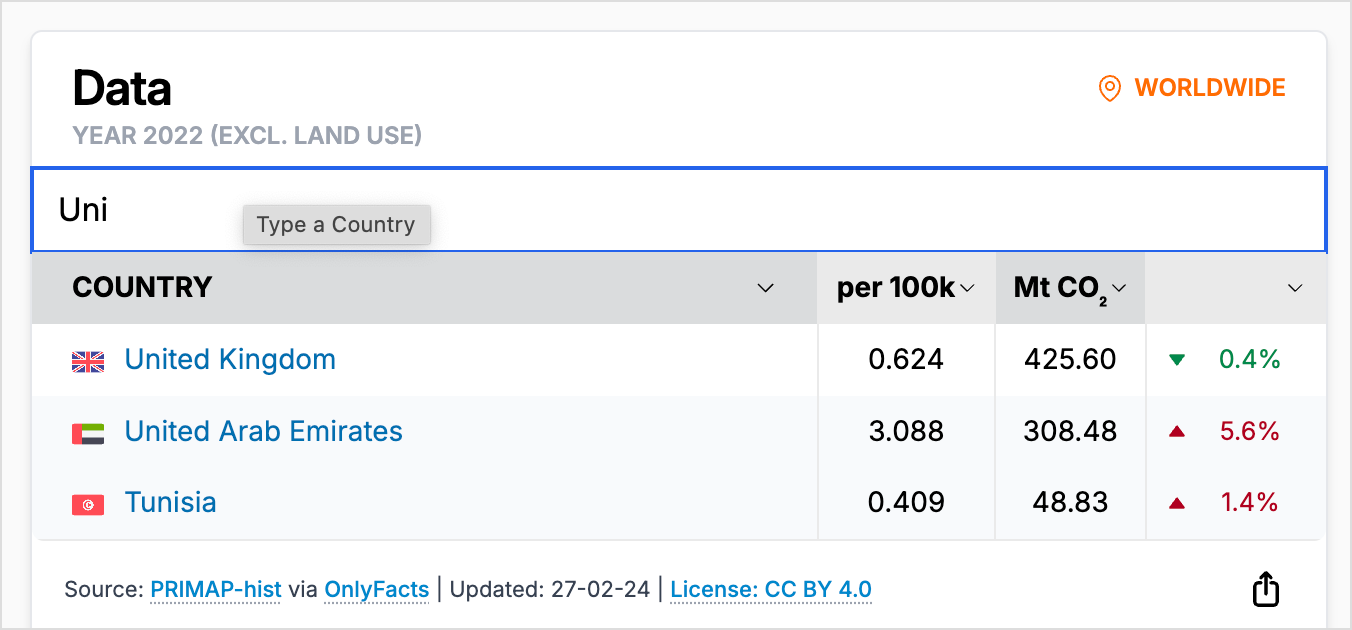
On the list and rankings pages, use the search bar to find the data for a specific location or organisation.
Tables and Data History
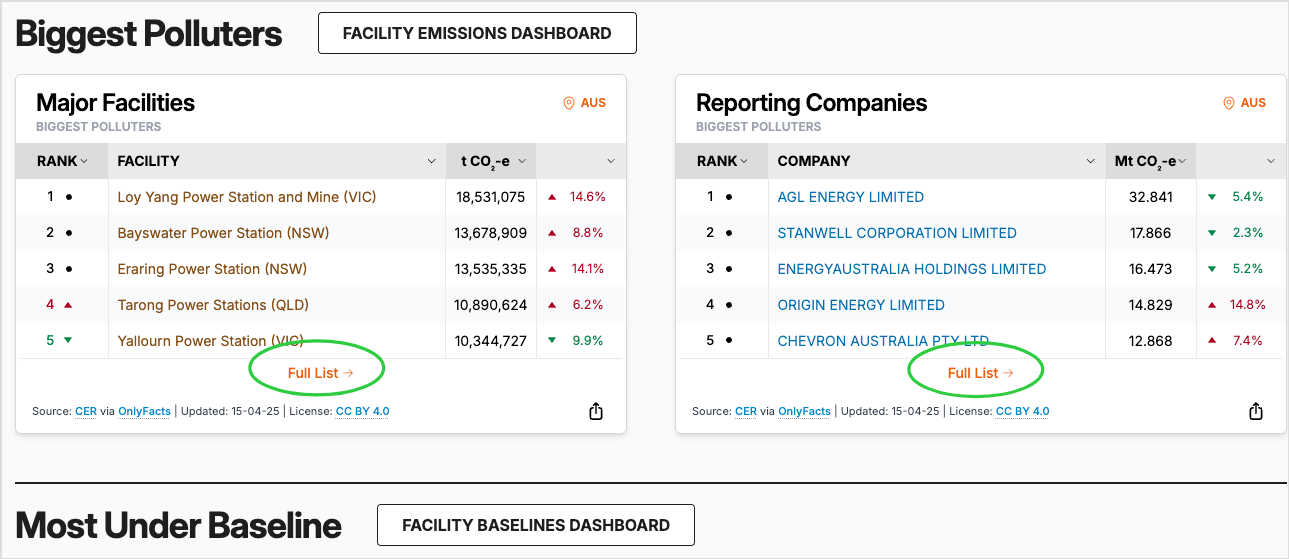
Tables are the doorway into data history. Click on the hyperlinks to drill into the 'Full List' to access, well, the full list.
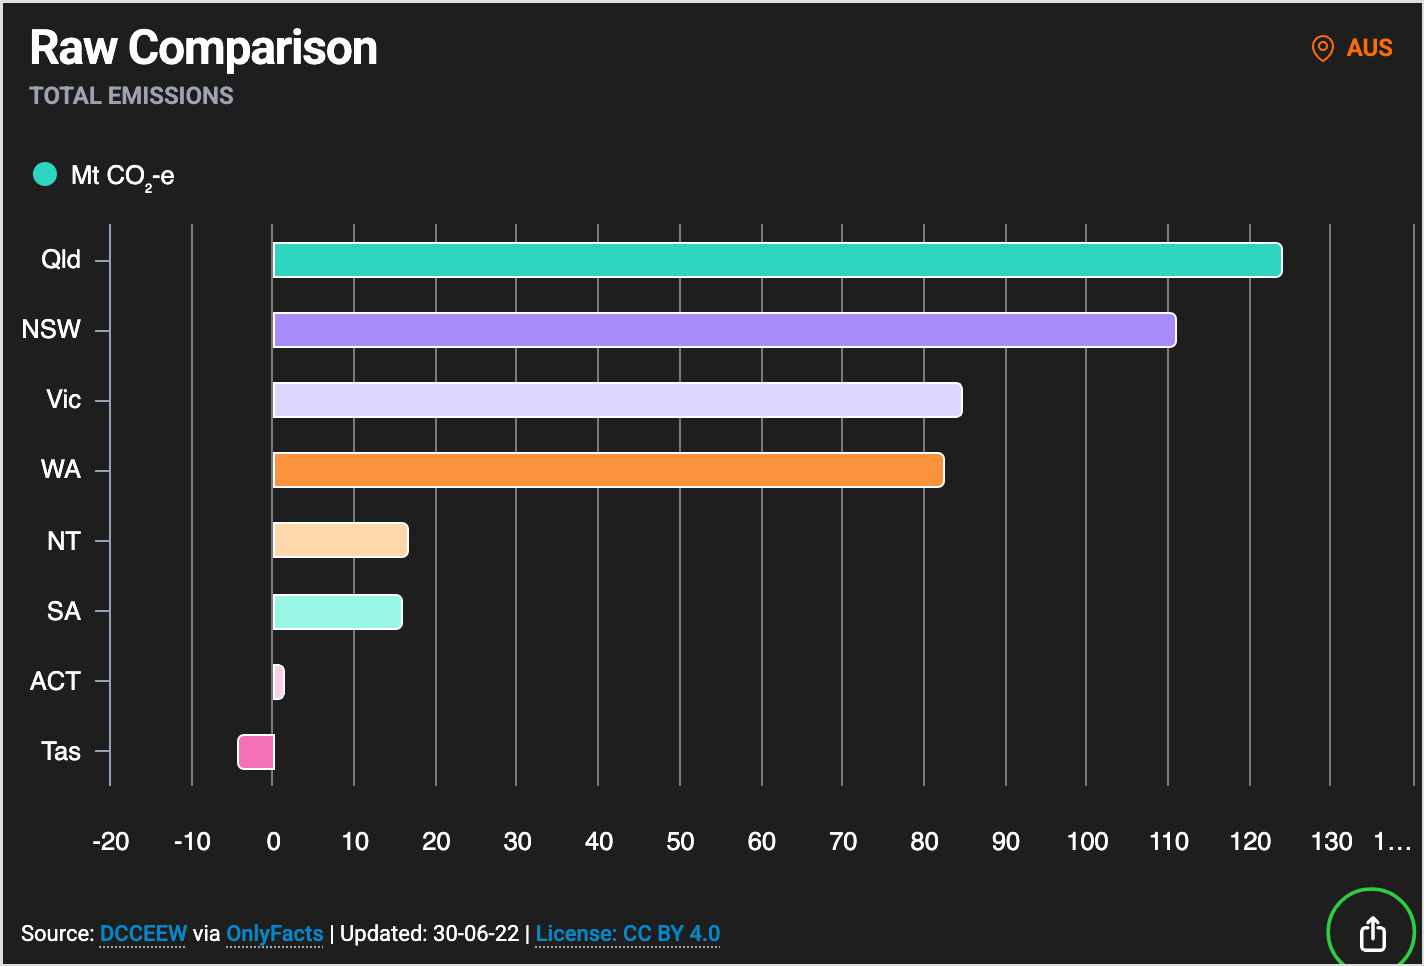
Sharing and Using the Data
We make it easy to share and use the data, charts, and content on OnlyFacts.
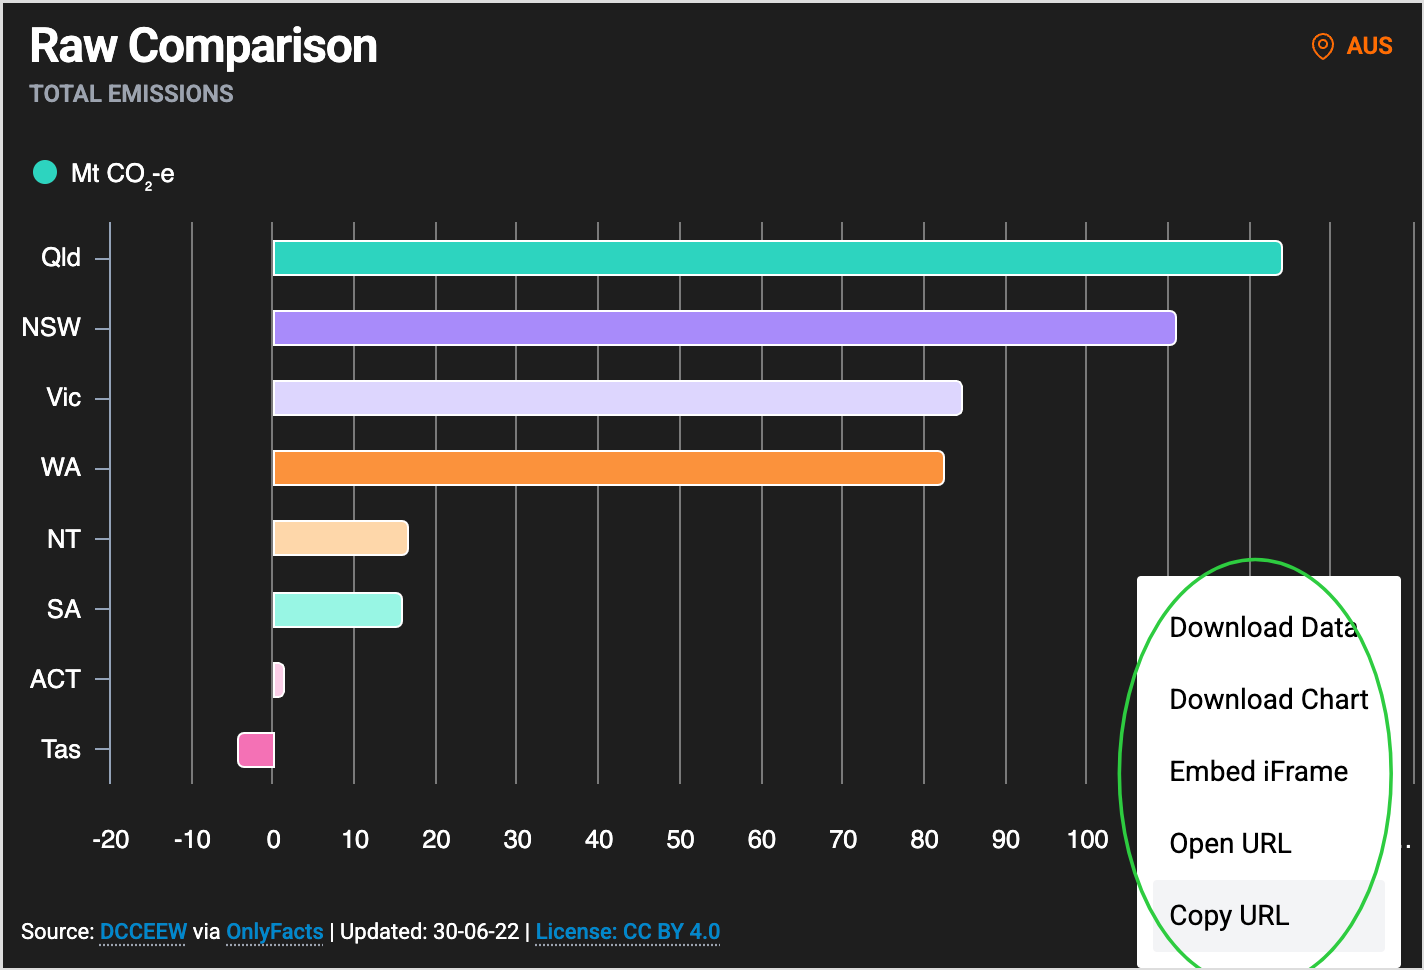
- Share and Embed: Every table and chart has a share button, allowing you to copy the embed code, download a PNG, or export the data.
- Link to Specific Charts: Want to share a particular chart? Click Open or Copy URL to get a direct link to its individual webpage.
If you’re interested in using our content, data, or charts, read our licensing options and terms and conditions.
Get Support and Give Feedback
We are always evolving—if you have suggestions or requests, we want to hear them. If you have a question, data request, or want to report an issue, please email us.
Stay Updated
We use our email newsletter and social platforms to introduce you to different aspects of the site and showcase its capabilities.
- Sign up for the OnlyFacts newsletter to receive data updates and direct links to relevant dashboards.
- Follow new data releases via our homepage and announcements.
- Connect with us on social media. You’ll find the links in the footer.
We’d love to have you as part of our community. See you there!