Aug 25, 2025
8 min read
🌳 When Carbon Credits Grow on Shrubs (Part 2)
On this page
Hi there!
Welcome to your climate data briefing – on a Monday for a change. (It needed some extra work over the weekend 👩🏻💻).
In the last newsletter, we looked at Australia’s particularly low threshold for what counts as ‘forest’. (Catch up here).
That raised bigger questions about one of the country’s main carbon levers: regenerating forest.
How is forest growth monitored, and rewarded?
Finding the answers to these seemingly simple questions led to an endless labyrinth of complexities. So this is a little longer than usual, despite my best attempts to keep the briefing, well, brief.
Let’s do it.
The Big Picture
To understand forest growth, we need to distinguish between two systems: Australia's national greenhouse accounts and carbon credits. Let's start with the first one.
When the country began publishing annual emissions estimates, it needed a way to quantify land change.
- Why? Because land is either a source or a sink of emissions. E.g. Clearing land releases carbon. Letting vegetation grow absorbs it.
In 2002, CSIRO set the rules in a technical report for the National Carbon Accounting Scheme (NCAS).
In short, tracking land change comes down to data classification 🥳.
The datapoints are pixels in satellite images with high resolution:
- Current satellite images (Landsat): Each pixel shows 25 x 25 metres (roughly the size of a suburban block 🏘️)
- New satellite images (Sentinel-2): Each pixel shows 10 x 10 metres (closer to a tennis court 🎾)
How it Works
- Step 1: Satellite pictures are combined into composite images that use the clearest pixels (e.g. no cloud cover).
- Step 2: Composites are stitched into a mosaic that covers the country, creating a national picture in a given year.
- Step 3: Pixels are classified into land types using rules. These aren't simple if-this-then-that rules. They use probability to factor in uncertainty. (It might be too deep in the weeds for you, but there's more detail at the end).
- Step 4: Changes get attributed to humans, nature or methodology. Most is automated and rule-based, but the latest greenhouse gas inventory said technical staff still review images.
Here's an illustration of part of the process. The first image shows land as captured; the second shows the same area classified as forest (green) or sparse vegetation (orange).
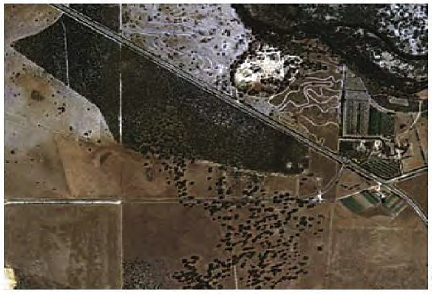
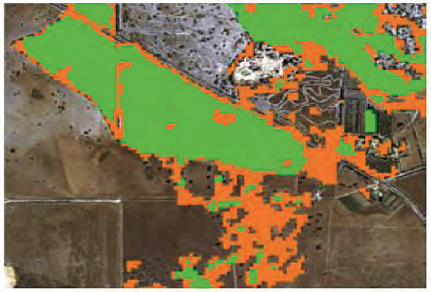
This system is designed to track change on the ground as pixels are recategorised.
But today, swaths of land are recognised as regenerating forest — well below the thresholds that would trigger new pixel classifications. 🌱
This is analysed differently. Let's take a look.
The Local Picture
To illustrate how forest regeneration is monitored and rewarded under the carbon credit scheme, we've chosen an example. 🧐
No suggestion is made that any person or company mentioned has acted unlawfully or unethically, or that the carbon credits lack legitimacy. To the contrary, this project is a microcosm of the broader system.
Darling River Eco Corridor 9 lies 140 kilometres west of Bourke. It covers just over 300 square kilometres (about a third the size of Canberra).
- Background: The Barton family has leased the property since 1927, grazing dorper sheep, a resilient meat breed suited to rangelands. 🐑
- Decades of heavy grazing and feral animals suppressed vegetation.
In 2016, the Bartons signed up with Terra Carbon (a company that manages carbon projects for landholders) to earn carbon credits by regenerating forest.
- How do they regenerate forest while still farming sheep? By undertaking agreed activities. In this case: changing grazing practices and controlling feral animals.
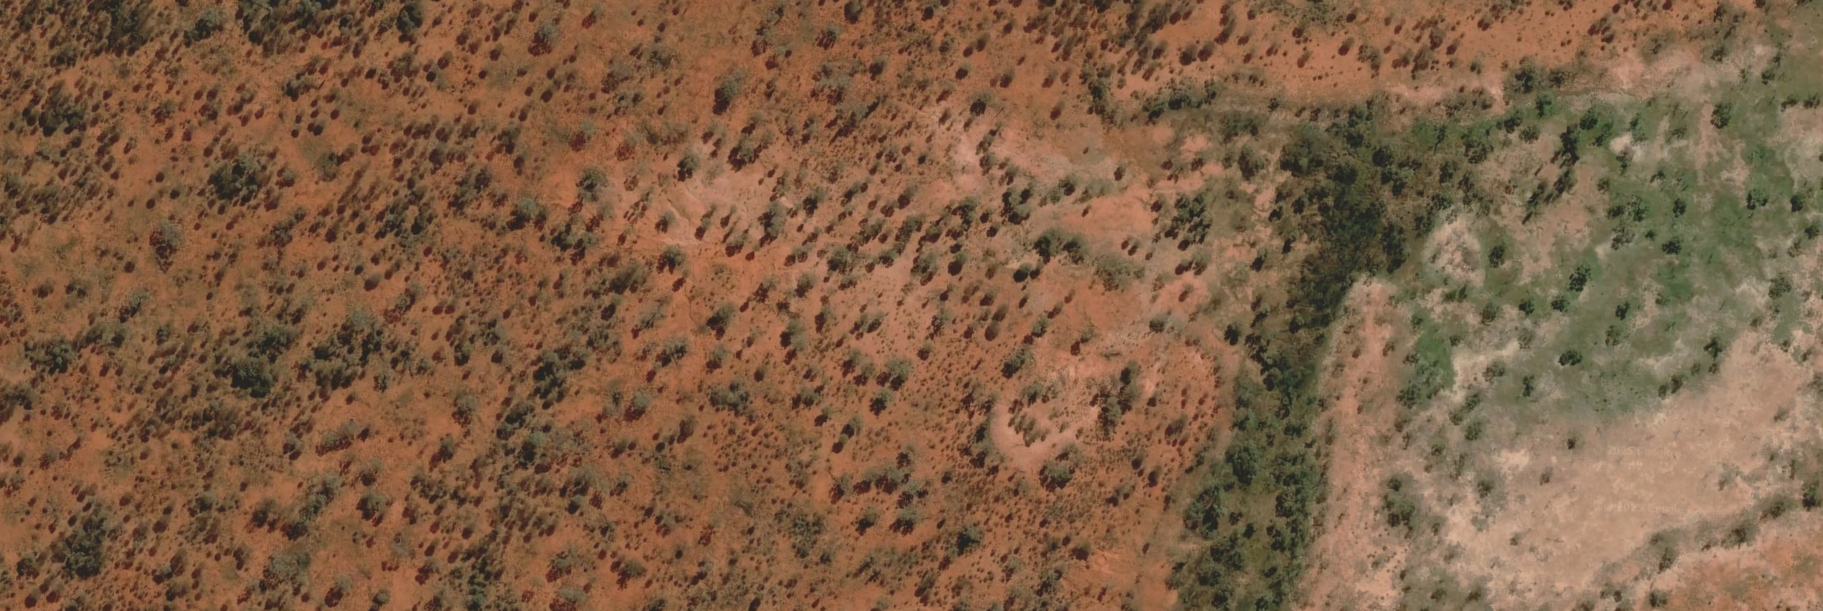
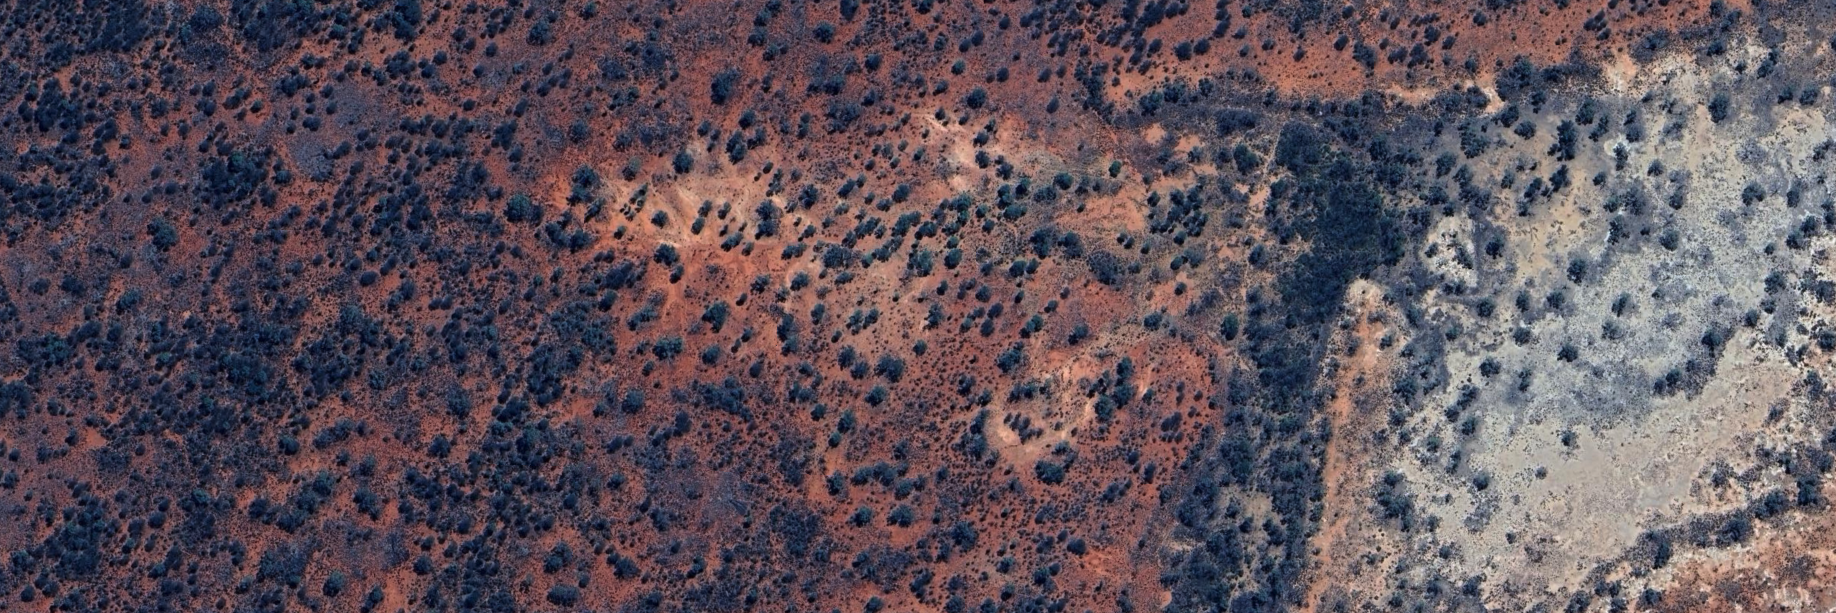
Here's a couple of Google Earth images showing part of the land in 2020 and 2023.
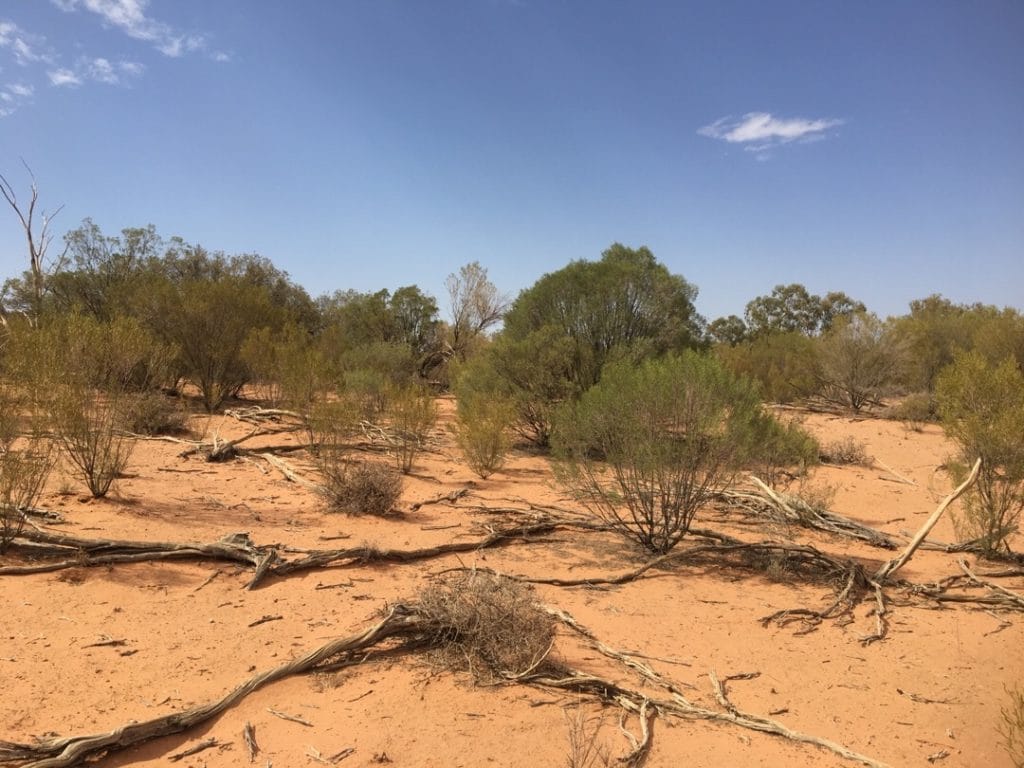
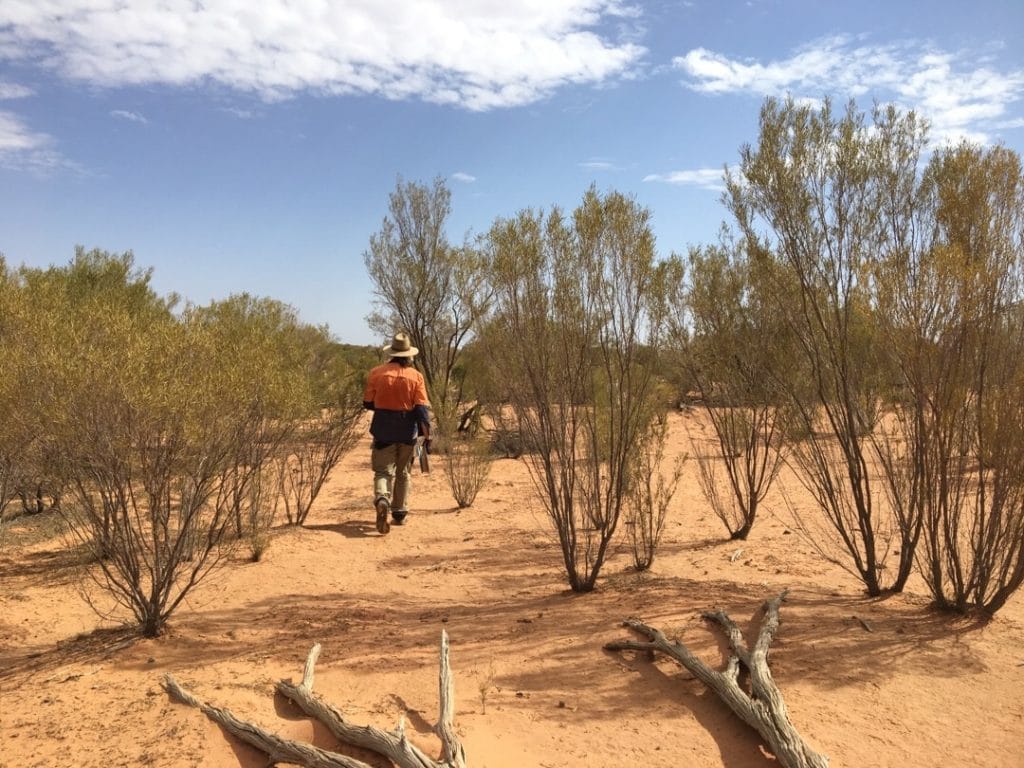
And here's a view of the land from the ground, published by GreenCollar. The date is unknown but it's part of a biomass survey to demonstrate growth.
Modelling the Forest
This land is not expected to meet ‘forest’ status until 2031, when 90% of the area should have trees over two metres high with at least 20% canopy cover.
But carbon credits don't wait for forest cover. They began accruing in year one.
🧠 That's because forest regeneration in the carbon credit scheme is determined through modelled land changes, not satellite images.
Here's how it works:
- Step 1: Project managers log events on the land, such as prescribed burns, bushfires, livestock grazing, feral foraging, or insects and disease affecting trees.
- Step 2: A computer model (that is calibrated for this particular site's location, vegetation and climate) uses those events to project how plants will grow.
- Step 3: That projection is converted into an estimate of carbon stored.
- The assumption: certain actions trigger predictable growth and carbon uptake. 📈
Auditing the Forest
Projects must go through regeneration checks, known as gateways.
- Year 6: 7.5% canopy cover
- Year 10: 10% canopy cover
This must be demonstrated by evidence, which can be change detection, remote images, or field data.
The Clean Energy Regulator (CER) also requires intermittent audits. Darling River Eco Corridor 9 had one in 2017. Auditors will use what they need to determine reasonable assurance the claims about forest regeneration are correct. ✅ This could be:
- Satellite images, especially to make sure there was no forest on the land before the project started
- Other data sources (like state fire and pest records)
- On-site verification (called ‘ground-truthing’)
- Geolocated photos
- Laser measuring tools mounted on light aircraft or drones, according to this article in The Age / SMH
How it’s Rewarded
Now for the credits.
Carbon abatement projects earn one Australian Carbon Credit Unit (ACCU) for every tonne of CO₂ sequestered through human action.
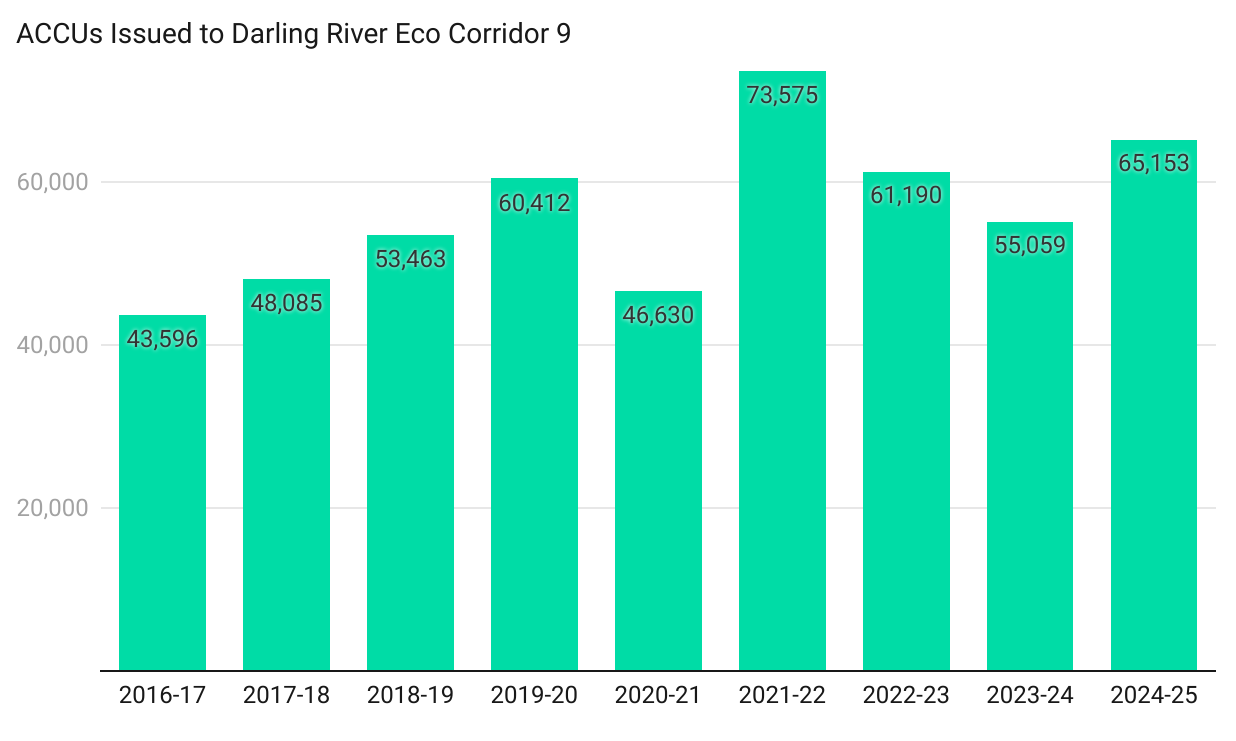
Darling River Eco Corridor 9 has been issued 507,000 ACCUs over eight years. That means the modelling suggests more than half a million tonnes of CO₂ is newly stored here, as a result of human actions.
It’s roughly the same as:
- 🚗 Taking 230,000 cars off the road for a year (based on an average of 2.2 tonnes of CO₂ per new light vehicle, using Green Vehicle Guide emissions data and ABS vehicle use figures)
- ⛏️ Shutting down Roy Hill mine, a major WA iron ore operation owned by Gina Rinehart’s Hancock Prospecting, for a year.
Dollar Value
ACCUs are financial instruments sold to the federal government or to corporates seeking to cut their on-paper emissions. 💸
Revenues aren’t disclosed, but contract data give a guide. For Darling River Eco Corridor 9:
- 228,000 ACCUs went to the Commonwealth under a fixed contract. At $12.00 per unit (the reported average), that’s about $2.7 million
- If the remaining 280,000 credits sold at today’s $36.50 generic price, they’d fetch about $10.2 million
- Terra Carbon likely paid exit fees to escape low-priced government contracts. Based on an original promise of nearly 400,000 units, that could have cost around $2 million
These numbers are indicative but here's the bottom line: Regenerating land generates millions.
Terra Carbon’s portfolio spans 103 projects (including other kinds of carbon abatement) with active government contracts for 66.5 million credits (via the ACCU register).
In 2023 GreenCollar, its parent company, was valued at $800m after Ontario Teachers’ Pension Plan bought a 49% stake. 🇨🇦
Win-Win
Carbon abatement projects promise a win-win. This one delivers.
✔️ Landholders win a second income.
✔️ Project organisers win a lucrative business.
✔️ Corporate emitters win credits at predictable prices that shrink their on-paper emissions.
✔️ Government wins by running a carbon scheme that balances competing interests.
But there's one more question: Does the planet win? 🌏
We’ll tackle that next time.
Blurbs
Worth Your Time
The U.S. nuclear industry is crowded with cautionary tales turned comeback stories. There are now 75 different reactor designs competing for attention, with Silicon Valley money bankrolling the race. The data centre boom and Trump's executive orders have fuelled fresh momentum for the low-emission-high-contention fuel that already supplies 18.6% of America’s energy mix. Critics and insiders warn the rush could raise the risk of accidents. (Heatmap, 6 August)
The global airline lobby expects sustainable aviation fuels will supply just 0.7% of total demand this year. To hit its net zero target, it would need a 300-fold jump. Of 165 projects announced by airlines over the past 12 years, only 36 have delivered any fuel — and just 10 at commercial scale. The main pathway (turning cooking oil, animal fat and non-edible crops into hydrocarbons) costs up to five times more than conventional jet fuel. Newer alternatives are just as pricey. (Reuters, 11 August)
The myriad interconnected processes that drive Earth’s climate include a few that, if pushed too far, would cause irreversible changes. These ‘tipping points’ include the melting of Greenland’s ice sheet and the collapse of a heat-moderating Atlantic current. A domino effect from one (such as an ice sheet’s worth of fresh water spilling into the ocean) could trigger another. But few governments are building tipping points into climate plans. (The Economist, 13 August)
💡 Final Thought
'You can summarise your thesis in a tweet, but should you?'
— Nick DeSantis
That's your climate data briefing. Hope you have a great week ahead. We'll be back at the (semi) regular time of Friday afternoon.
💛 Juliette and the OnlyFacts team
Track datapoints that matter to you.
→ Detail about probabilistic rules in land classifications (S.Furby, 2002, Land Cover Change: Specification for Remote Sensing Analysis, CSIRO Mathematical and Information Sciences, pp 48-49):
The advantage of [Conditional probability networks, (CPNs)] over typical ‘if-then-else’ rule-based systems is that they incorporate the uncertainties in the input datasets into the classification process. Consider the rule ‘if the label in years 1 and 2 is forest and the label in years 3 and 4 is non-forest, then the region has been deforested’. In a simple if-then-else rule-based system, all pixels with this label combination are treated equivalently no matter whether the labels are well-defined (high probability, low uncertainty) or very poorly defined (lower probability, high uncertainty). By using probabilities instead of just labels, it is possible to discriminate between a site that has a probability of 1.0 [the maximum] for forest cover in years 1 and 2 and a probability of 0.0 [the minimum] for forest cover in years 3 and 4 and a site that has probabilities of 0.7 and 0.6 for forest cover in years 1 and 2 and probabilities of 0.45 and 0.3 for forest cover in years 3 and 4. The former site is almost certainly deforested (and consequently the land use has changed), but the latter site may represent decline or thinning of sparse tree cover rather than any actual deforestation (or forest conversion) and consequent change in land use. The final probabilities from the CPN model distinguish between these two situations.