Feb 14, 2026
9 min read
💘 🛻 I Love U…tes. Australia's Ute Affair and Transport Emissions (Part 3)
On this page
Good Saturday afternoon, and welcome to your climate data briefing.
We're closing out Week 7 of 2026 ... 12% of the year is through. 💘 Mortifyingly, this is our first briefing of the year. 🫥
To help make up for lost time, this one's a double whopper. 🍔 Maybe even a triple! We're picking up where we left off: what's driving transport emissions?
Here's a quick recap:
- Transport is Australia's 2nd-largest emitting sector and on track to become the largest
- Within transport, roads create the lion's share of emissions
- Passenger vehicles (sedans and SUVs) create just over half of road emissions
- Despite our cars being bigger, more numerous, and driven further, their emissions have fallen
- That's because modern cars are far more efficient than they were 20 years ago
Several of you asked the logical next question: what about utes? That's today's focus.
Let's take a look. Honk! 🛻
Ps. This so-called briefing is a little long but the format is simple: 1x analysis, 2x quantish reads, 3x data updates. The analysis is designed to be scannable with a few key takeaways. Today's data updates include the national quarterly emissions report.
We don't take your trust for granted. You can review the sources and calculations in this briefing yourself.
Terminology Notes + FAQs
Utes and LCVs:
- Utes are categorised as light commercial vehicles (LCVs).
- For reasons I can only assume are punishment for wrongs in a past life, the LCV definition changes depending on context. 💀
- In sales and registration data, LCVs are vehicles designed to carry goods up to 3.5 tonnes when fully loaded. In practice, that mostly means utes and vans. 🛻 🚐
- A back-of-envelope calculation using sales data suggests utes outnumber vans in this category by roughly 6:1.
Passenger vehicles and cars:
- On OnlyFacts.io, we refer to passenger vehicles simply as 'cars'. In this briefing, we use the terms interchangeably. The category includes SUVs.
- If we're talking about cars excluding SUVs, we say sedans and hatchbacks.
Q: Why are all comparisons with 2005?
- That's the baseline year for emissions targets (2030 target: -43% versus 2005).
Why Do Utes and Vans Matter?
First, some context. Utes and vans account for roughly 22% of transport emissions and about 4% of Australia’s net total.
Here are the trends:
- LCV emissions are +62% higher than in 2005
- Car emissions are -5% lower
The charts below show them side-by-side. Here they are on separate y-axes to show the trends.
Here they are on the same y-axis to show scale.
Car emissions tanked during Covid and have not recovered (although this emissions data is still stuck in 2023 😒). LCV emissions dipped briefly but are now higher than their pre-Covid peak.
LCV emissions are rising. Why?
Are There More Utes and Vans on Our Roads? Of Course.
The chart below shows the top 10 new vehicles sold over the past 20 years. Three things stand out:
- Sedans and hatchback popularity has collapsed
- SUVs have largely replaced them
- Utes have helped
Notice how utes have always been popular, but now they consistently occupy three or four spots in the top 10 each year.
The data for overall sales tells a similar story. Sedans and hatchbacks have been sidelined, largely by SUVs and in part by utes.
Share of total sales in 2025 (change since 2005):
- SUVs: 61% (+43%)
- LCVs: 22% (+5%)
- Sedans and Hatchbacks: 13% (-48%)
- Other / Heavy: 4% (+0.5%)
These sales patterns feed total registrations.
Since 2005, the number of LCVs on the road has more than doubled – up +106% to 4.2 million. Over the same period, car numbers rose +44%.
As a result, LCVs claim a larger share of the fleet.
- 2005: 15% (roughly 1 in 7 vehicles)
- 2025: 19% (closer to 1 in 5)
SUVs are replacing sedans and hatchbacks, but they're not doing it alone — LCVs are helping.
Are Utes and Vans Being Driven Further? You Bet.
The total distance driven by LCVs in 2025 was +71% higher than in 2005. For passenger vehicles, the increase was +7%.
Part of that gap reflects base effects (percentages are bigger off smaller numbers). But the real-world difference is bigger also:
- Passenger vehicles: +11.3 billion kilometres since 2005
- LCVs: +25.1 billion kilometres (more than 2x more)
Below are cars and LCVs by distance travelled. Here's the trend (different y-axes).
And here's the scale (same y-axis).
If we unpacked every factor behind LCV growth, this would become a PhD on utes. 🫠
For instance, freight in LCVs is up +51% to 6 billion tonne kilometres. That's a lot of Amazon packages ...
But the point is LCV distance has risen broadly in line with emissions, while car distance also grew — but emissions fell.
In the last briefing, we found modern sedans and SUVs are far more emissions efficient than they were 20 years ago. Can the same be said for utes?
Are Utes More Efficient? That Depends.
Let's dig into the kinds of utes we're buying. Here are the most popular in 2005 and 2025:
2005
🥇 Toyota Hilux (31,369)
🥈 Holden Rodeo (24,582)
🥉 Holden Utility (20,202)
2025
🥇 Ford Ranger (56,555)
🥈 Toyota Hilux (51,297)
🥉 Isuzu D-Max (26,839)
*Correction: The figures above were labelled 4x4 sales. They are 4x4 and 4x2 sales combined.
👀 Sidenote on the scale of ute popularity ... Last year, the Ranger, Hilux and D-Max were not just top-10 sellers; they were three of the top four new vehicles sold in Australia. Together, they sold nearly 135,000 utes. That's nearly 11% of all sales and more than all electric models combined (103,000).
Next, let's find the emissions intensity of these models. This is measured in grams of CO₂ per kilometre (g/km). The chart below shows the top 3 sellers and average emissions of their latest models in 2005 and 2025.
By this measure, the top 3 utes in 2025 were far more efficient than the top 3 in 2005.
The average intensity across the 3 fell -31%.
But there's another way to look at this.
Vehicles come in a cornucopia of variants — transmissions, engine sizes, body styles etc. The chart above uses a simple average, which gives each variant equal weight. The National Transport Commission (NTC) calculates a sales-weighted average, where variants contribute more or less depending on the number sold.
The sales-weighted average tells us what people actually buy.
Because of data availability and consistency, we need to use data from 2017 and 2023. We'll keep the 4x4 and 4x2 figures separate. Here are the top-selling utes for those years:
2017
🥇 Ford Ranger 4x4 (36,932)
🥈 Toyota Hilux 4x4 (35,297)
🥉 Mitsubishi Triton 4x4 (20,513)
2023
🥇 Ford Ranger 4x4 (58,261)
🥈 Toyota Hilux 4x4 (48,995)
🥉 Isuzu D-Max 4x4 (25,443)
On a simple average basis, efficiency improved between 2017 and 2023 – but modestly.
- Toyota Hilux: emissions intensity fell -8%
- Ford Ranger: emissions intensity fell -11%
- Mitsubishi Triton: was replaced in the top 3 by the higher-emitting Isuzu D-Max
Across the 3 models, the simple average fell -5%.
But the weighted average tells a different story — the collective emissions intensity rose.
- Toyota Hilux: emissions intensity fell -1%
- Ford Ranger: emissions intensity fell -3%
- Isuzu D-Max: Not only did the D-Max replace the lower-emissions Triton, its weighted average was +1% higher than the simple average
Across the 3 models, the weighted average increased +0.5%.
Zoom out to the 4x4 segment as a whole.
The weighted average across all 4x4 models showed no change in emissions intensity between 2017 and 2023.
Emissions intensity for all 4x4 utes:
- 2017: 222 g/km
- 2023: 222 g/km (+0%)
Compare that with the weighted average for Medium SUVs:
- 2017: 173 g/km
- 2023: 135 g/km (-22%)
Next time, we'll bring all of this together and look at the number that wraps up hundreds of models, thousands of variants, and millions of consumer decisions ... the fleet-wide emissions intensity. Teaser: the choices of a few have a disproportionate impact.
Quantish Reads
Winter Illusion
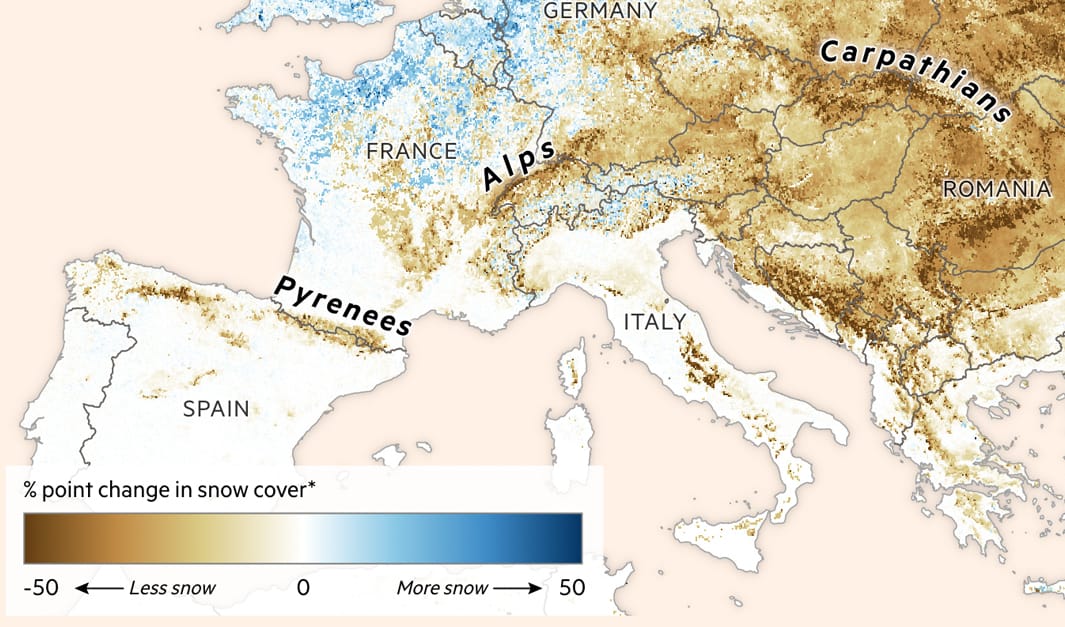
This month, heavy snow fell on Cortina d'Ampezzo, cohost of the Winter Olympic Games. Annually, however, the town records one-fifth fewer freezing days than in the decade after it last hosted in 1956. With snow cover and cold days in decline, about 90% of Italy's ski slopes now use artificial snow. For the Olympics, large reservoirs were created to supply water for snow-making, although organisers have said they've needed less than forecast. 'Milano-Cortina 2026 is often framed as a return to the traditional Alps, but it is a technologically manufactured reality.' (Financial Times)
Peak Tease
Useful analysis of China's emissions, which have been flat or falling for 21 months. That's the longest streak not associated with lower energy demand. But don't say emissions have peaked, yet. The country has pledged to reduce carbon intensity (emissions per unit of GDP) by -65% by 2030 (vs 2005 levels). To get there, it needed to hit -18% during 2020-25. It delivered -12%. Are China's policymakers still committed to the pledge? That's a 'key open question'. An important signal will arrive in March with the five-year plan for 2026-30. (Carbon Brief)

Data Updates
🎯 Australia's National Emissions
Year to September 2025
Net total: 436.2 MtCO2-e (-2.7% vs prev year)
- Target: -43% (vs 2005) by 2030
- Current status: -28.7%
- Current pace: -2.7% per year
- Needed pace: -3.6% per year
- If nothing changes: -37% by 2030
☁ Sector Emissions
Year to September 2025
Ranked by change from previous year:
- 🥇 Fugitive Emissions: 44.3 MtCO2-e (-7.3%)
- 🥈 Electricity: 147.5 MtCO2-e (-3.6%)
- 🥉 Stationary Energy: 95.2 MtCO2-e (-2.2%)
- 4. Industrial Processes: 30.0 MtCO2-e (-1.6%)
- 5. Agriculture: 80.5 MtCO2-e (-0.4%)
- 5. Transport: 98.6 MtCO2-e (-0.4%)
- 🥄 6. Land Use: -73.8 MtCO2-e (+0%)
- 🥄 6. Waste: 13.8 MtCO2-e (+0%)
Ranked by change from 2005:
- 🥇 Land Use: -195.8%
- 🥈 Electricity: -25.0%
- 🥉 Waste: -12.7%
- 4. Agriculture: -7.3%
- 5. Industrial Processes: -0.3%
- 6. Fugitive Emissions: +3.7%
- 7. Stationary Energy: +17.1%
- 🥄 8. Transport: +20.5%
⚡Renewables in Major Grids
Past week (vs. same week in 2025)
Final Thought
'The evidence of performance is a number.'
— Jim Maxwell
That's your climate data briefing. Wishing you a great weekend ahead. We'll be back in your inbox very soon.
💛 Juliette and the OnlyFacts team
🪽 Personal Note 🪽
Carlos Monteiro was a special colleague, mentor and friend. He did the demanding, behind-the-scenes work that underpins digital journalism and publishing. As digital managing editor at Fairfax through one of journalism's most turbulent transitions, he helped shape the industry's shift to digital in Australia. He was a loyal collaborator on covid19data.com.au, and great supporter of OnlyFacts. This is the first newsletter I'll publish without a message from Carlos offering encouragement and gentle feedback. I dedicate my work to his memory, and will strive to emulate his standards, humility, and work ethic.
💫 Did you find this briefing useful?
We create bespoke briefings for organisations — combining rigorous research, clear analysis, and compelling visualisations. ✅
If you'd like to know more, just reply 'More info'.👋