Oct 24, 2025
6 min read
🚐 What's Driving Australia's Transport Emissions? (Part 1)
On this page
Good Friday evening, and welcome to your climate data briefing.
We're closing out week 43 of 2025 — the year is 81% done. 🎃
A quick rewind: in our last briefing (which was a few weeks ago, I'm sorry 😶🌫️), we unpacked factors driving emissions across four sectors.
The takeaway: Beneath the headline numbers are real efficiency gains and changing habits, but also weaker economic activity in places and macro factors beyond our control.
This week, we turn to transport. 🚙
Rather than jumping straight into the topic that always dominates - electric vehicles - I wanted to take a step back, and understand how EVs fit into the broader picture.
Before we dive in though, a wee note about format ... I've been told these briefings could be a little more, well, brief. And I agree! So, to do that without sacrificing steps in logic or transparency, we plan to publish more serials. That means topics will be spread across several editions instead of packing everything into one. The goal is snappier reads with clearer takeaways. It might mean we occasionally end on a bit of a 'well, duh' note, but that's the trade-off for staying concise. I hope it works for you, and I'd love to know.
Ok. Let's get moving on transport! 🛵
We don't take your trust for granted. You can check the main sources and calculations in this briefing for yourself.
Why Transport Emissions Matter
Transport is now Australia’s second-largest emitting sector, responsible for 23% of total domestic emissions. ✌️
In the chart below, the boxes are scaled to each sector's share (excluding the Land Use sector, which is a net negative). The figures are annual million tonnes of carbon dioxide equivalent (Mt CO2-e).
According to the Climate Change Authority (CCA), transport is expected to overtake electricity as the top emitter by 2030. 📈
The maths is pretty simple: electricity emissions (the largest sector today) are falling, while transport emissions are not.
Today’s emissions compared with 2005:
- Electricity: -25% (-49.1 million tonnes CO2 equivalent / year)
- Transport: +20.3% (+16.6 million / year)
The chart below shows the two curves moving towards each other.
Admittedly, since the CCA's projection in 2024, cuts in electricity emissions have slowed. 🐢 But the direction of travel is the same. 👇
Even if the crossover comes later than 2030, transport is still heading towards the top of the emissions table.
Beneath the Transport Curve
Transport emissions fall into four main categories: road, domestic air, rail, and domestic shipping.
The data below only runs to June 2023. Loyal readers will know I'm perpetually peeved about these lags, especially since it traps us in an era still skewed by Covid disruptions. 😤
But the main point hasn't changed, and that's proportions: road transport swamps the rest.
Here's the emissions contribution of each mode of transport:
- Road: 84%
- Domestic air: 9%
- Rail: 4%
- Domestic shipping and other: 3%
The chart below nests each one inside the transport sector, to show how they feed into the national picture.
How are they trending (albeit to June 2023)? Since 2005, emissions have grown across the board.
- Road: +13% (+9.3 million tonnes CO2-e / year)
- Domestic air: +68% (+3.7 million / year)
- Rail: +92% (+1.7 million / year)
- Shipping and other: +3% (+0.1 million / year)
Let's break that chart into a grid to see each category's trend more clearly.
By June 2023, domestic air travel had fully rebounded from Covid, while road transport was still well below pre-pandemic levels.
What Drives Road Emissions?
Road transport breaks down into four categories: cars, light commercial vehicles, heavy-duty vehicles, and motorcycles.
Here's what they include:
- Cars: Also called passenger vehicles. Includes SUVs.
- Light commercial vehicles: Used for business and weighing < 3.5 tonnes. Includes utes.
- Heavy-duty vehicles: Trucks and buses. Off-road vehicles used in industry (e.g. mining or agriculture) are excluded. Their emissions are allocated to categories based on functional activity, which isn't considered to be transport.
The chart below nests each of these sub-categories within road. It shows the matryoshka effect of emissions🪆 - how the national figure cascades to transport, then to road, and so on.
Road transport emissions break down into these shares:
- Cars: 51%
- Light commercial: 22%
- Heavy-duty: 27%
- Motorcycles: 0.3%
Here's each category's 2023 emissions compared with 2005:
- Cars: -5% (-2 million tonnes CO2-e / year)
- Light commercial: +62% (+6.8 million / year)
- Heavy-duty: +26% (+4.5 million / year)
- Motorcycles: +27% (+0.05 million / year)
Again, let's break that chart into a grid to see the trends.
Car emissions plunged during the pandemic and remain below pre-Covid levels. By contrast, light commercial and heavy-duty vehicles have powered steadily ahead, barely registering the disruption.
It's a tug-of-war that is rippling up to Australia's national ambitions.
Next time, we'll look at the concrete factors shaping these curves: number of vehicles on the roads, how often they're used, and what kinds they are.
Quantish Reads
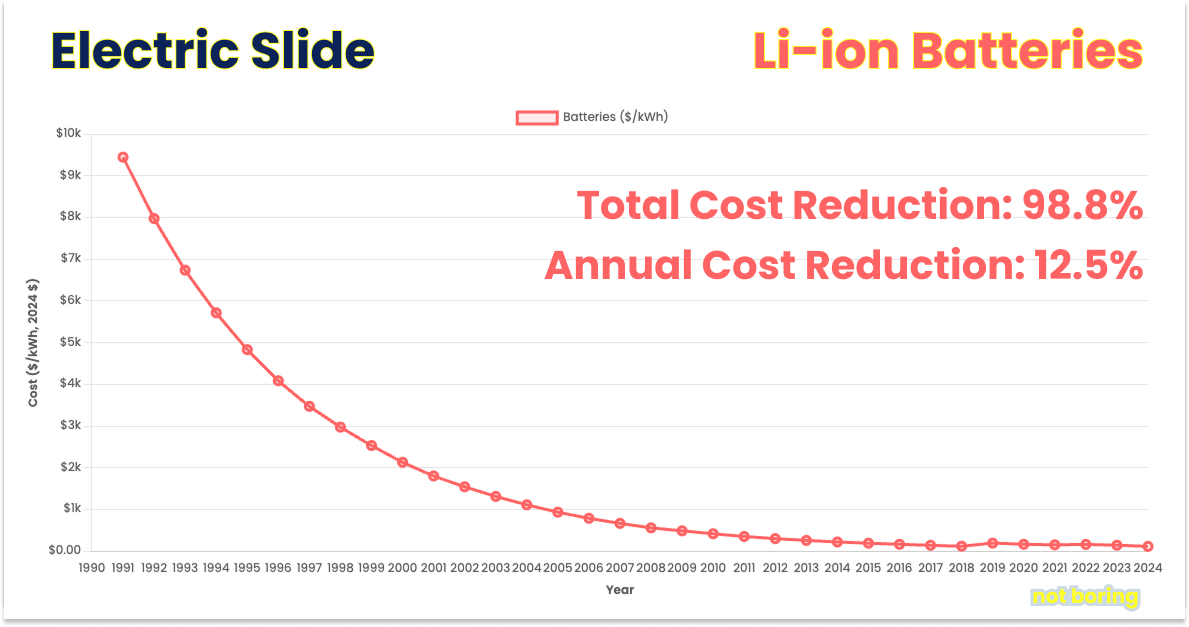
A 'surprisingly thrilling' 40,000-word essay about the Electric Stack: the technologies that turn electricity into action. Lithium-ion batteries, magnets and electric motors, power electronics, and embedded compute were invented in America, Japan, and the UK. Then, they sold the future. Today, the Stack is cheap (its cost has fallen 99% since 1990) — and China controls it. Meanwhile, electrification in America (and Australia) has become politicised. An engrossing read on 'what becomes possible, soon, if you follow the curves.' (Not Boring)
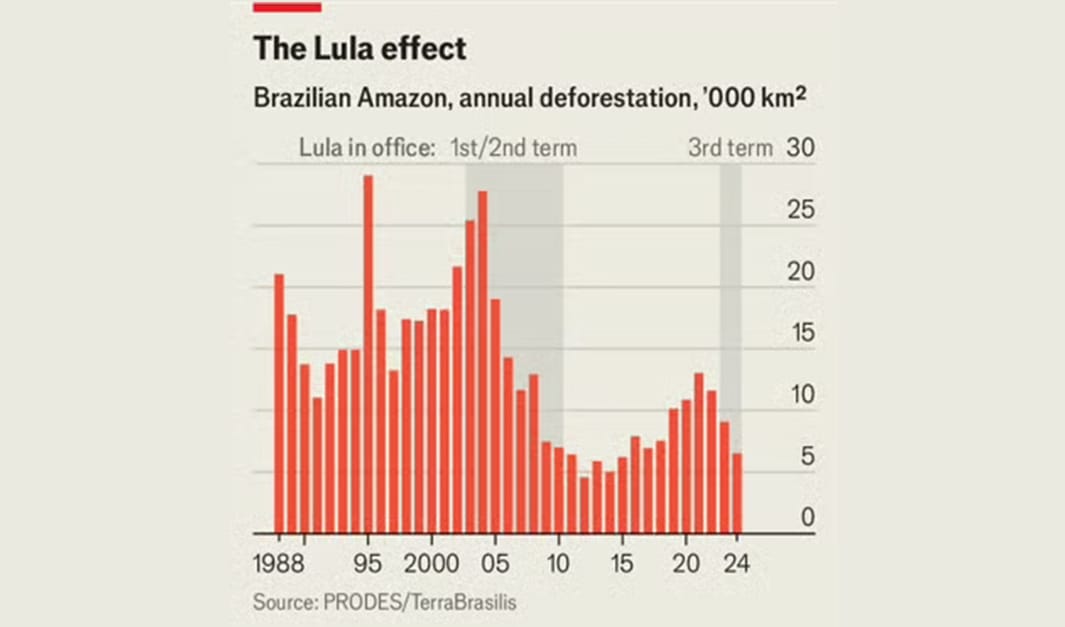
Brazil’s 'Legal Amazon' region is roughly 60% of the entire forest. In 2018, emissions from clearing rainforest here for farming were as high per person as those in Qatar. Yet, 'residents of the Legal Amazon benefit little from emitting carbon on the scale of a petrostate: the region's GDP per person is $5,900. The figure in Qatar is about $76,000'. 'No single country has emitted so much [per person] and created so little wealth.' That could open the door for a deal that starts with valuing the forest as an economic asset. (The Economist)
Data Updates
🛻 Vehicle Registrations (updated annually)
As of January 2025, EVs made up 1.2% of all registered vehicles in Australia.
- Petrol: 66.0%
- Diesel: 29.4%
- Hybrid (inc. PHEV): 3.2%
- EV: 1.2% (+0.4 percentage point increase on Jan 2024)
- Other: 0.2%
🚗 Car sales (updated monthly)
In September, EVs made up 11.7% of new car sales. That’s the highest share on record.
- Petrol: 39.6%
- Diesel: 30.0%
- Hybrid: 14.4%
- EV: 11.7% (+1.1 percentage points on August)
- PHEV: 4.4%
☀️ Renewables by Grid (updated daily)
This month so far, the proportion of electricity that came from renewables in Australia's main grids has been:
🇦🇺 Renewables by State (updated daily)
This month so far, the proportion of electricity that came from renewables in each State and Territory has been:
- 🥇 TAS: 100.0% (+0.4 percentage points vs. October 2024)
- 🥈 SA: 84.6% (-3.0 pp)
- 🥉 VIC: 54.7% (+6.3 pp)
- NSW: +48.4% (+5.4 pp)
- WA: 45.3% (+1.6 pp)
- QLD: 38.4% (+3.3 pp)
- NT: 20.2% (+4.8 pp)
Final Thought
'The time to make up your mind about people, is never.'
— Philip Barry
That's your climate data briefing for this week. Wishing you a great weekend. Pens down! ✍️
💛 Juliette and the OnlyFacts team
Need dashboards, analysis or data-driven content? We level the data playing field by working with Davids, not Goliaths.