Sep 23, 2025
6 min read
📉 Falling Emissions: Doing Better, or Doing Less?
On this page
Hi there! Welcome to your climate data briefing, this Tuesday lunchtime (AEST). 🥪
It's the 39th week of the year, which means we've hurtled into the final quarter of 2025. 🚄
Climate flooded last week’s news, most of it about the future. OnlyFacts focuses on the present. Here's how we'll address the big announcements:
- 🌏 Climate risk assessment: It's a shopping list of indicators to track, using our model of timely and accessible data, metric-by-metric breakdowns and peer comparisons. Watch this space.
- 🎯 2035 targets: We'll add the new targets to the dashboard and track progress. The opinions are flying, which we avoid. We stick to data and finding answers to one deceptively simple question: what is happening?
Let's do exactly that, right now, with the latest greenhouse gas update.
📉 Big and Small Pictures
The two latest quarterly updates for Australia's greenhouse gases show a sea of green. Emissions are down, stable or pending across all sectors.
Percentages below show change compared with the previous year*. Mt CO₂e = million tonnes of carbon dioxide equivalent.
They're not huge margins, as the big picture curve shows.
But zoom in on the most recent quarters 🔎 and the gains are clearer.
Assuming an if-nothing-changes linear path, we're still not on track for the 2030 or 2035 targets.
👣 Current pace: -1.7% per year (-10.5 Mt CO₂e / yr)
🎯 What's needed:
- 2030 (-43% v 2005): -2.9% per year (-17.4 / Mt CO₂e yr)
- 2035 lower (-62% v 2005): -3.3% per year (-20.3 Mt CO₂e / yr)
- 2035 upper (-70% v 2005): -4.1% per year (-25.2 Mt CO₂e / yr)
Let's go beyond the top-line numbers to ask, what's driving the curve?
The headline figure combines eight sectors of the Australian economy, each with its own subsectors.
Today we focus on four: electricity, stationary energy, industrial processes, and agriculture.
Note: The government's quarterly updates give provisional figures for the latest quarter (June), and confirmed figures with commentary for the previous quarter (March).
⚡️ Electricity Sector
- Australia's biggest emitting sector (147.6 Mt CO₂e: 34% of net emissions)
- March update: -0.5% (vs previous year)
- June update: -3.3%
If the goal is more output with fewer emissions, the electricity sector is a star. 🌟
The chart below shows emissions falling, while the amount of electricity generated rises.
More power, less pollution? That's the picture of abundance. 🌇
The reason for this is well-known: renewable fuel sources are displacing fossil fuels.
Emissions from renewables are so much lower than those from fossil fuels, they're practically negligible.
Here's the contribution of wind and solar in 2023-24:
- One fifth (20.9%) of all electricity generated
- One thousandth (0.1%) of the sector's emissions 🤏
🏠 Stationary Energy Sector
- Australia's 3rd biggest emitting sector (94.9 Mt CO₂e: 22% of net emissions)
- March update: -2.7% (vs previous year)
- June update: -2.5%
Stationary energy refers to fuel combustion outside electricity generation and transport, such as buildings (including homes and businesses), industry and mining.
Emissions in this sector have been falling since 2022.
A key factor: weaker residential gas demand. 🍳
- Residential and commercial gas use emissions ≈ 10.2 Mt CO₂e (11% of the sector; 2.3% of Australia's total).
The chart below shows emissions dipping as residential and commercial gas demand falls.
According to the Quarterly Update, another factor behind the emissions cuts was a drop in coal use in metal manufacturing.
Does that point to efficiency gains from fuel switching, or something else? 🧐
To probe that, let's look at the sector where metal manufacturing emissions are reported — industrial processes.
🧑🏭 Industrial Processes and Product Use Sector
- Australia's 6th biggest emitting sector (30 Mt CO₂e: 7% of reported emissions)
- March update: -4.8% (vs previous year)
- June update: -2.3%
Industrial Process emissions have two main sources: process-related emissions from producing chemicals, metals and minerals; and synthetic gases used in products like refrigerators and air conditioners.
The Quarterly Update reports genuine emissions reductions in the sector:
- 🏅 Lower perfluorocarbon releases in aluminium smelting
- 🏅 Reduced nitrous oxide from nitric acid production
But the bigger driver was not efficiency; it was production. Australia made less steel.🔻
- Metal industry emissions ≈ 10.7 Mt CO₂e (35% of the sector; 2.5% of Australia's total)
- Iron and steel ≈ three-quarters of the metal industry
The chart below shows industrial process emissions and crude steel production since 2010. It's a picture of produce less, emit less.
🧑🌾 Agriculture Sector
- Australia's 4th biggest emitting sector (79.7 Mt CO₂e: 18% of reported emissions)
- March update: -1.1% (vs previous year)
- June update: -0.4%
Agriculture emissions come from livestock, manure, soils, rice and field burning.
Year-on-year agricultural emissions have fallen for seven consecutive quarters, partly due to coming off record crop production that had temporarily bumped emissions higher.
But another key driver is fewer grazing cattle 🐄 and sheep 🐑.
- Emissions from enteric fermentation (belching and flatulent animals) ≈ 54.7 Mt CO₂e (69% of the sector; 12.5% of Australia's total)
The charts below show falling emissions along with herd numbers.
What's behind the fall? Are consumers making environmental choices? No.
Dry conditions have forced producers to reduce herd sizes, by sending more animals to slaughter, according to the Australian Bureau of Statistics (ABS).
See how cattle and sheep slaughters have jumped. 🩸
Meanwhile, Australians are eating more meat than ever. 🥩
Per capita consumption of beef, lamb and pork increased by +3.7% to 48 grams per day in 2023-24, according to the ABS.
Upshot
Headline emissions changes don't tell us whether they stem from real efficiencies, shifts in consumer behaviour, shrinking economic activity, or macro factors beyond our control. To understand progress, we need to look beyond the totals and examine what's driving the curve.
We don't take your trust for granted. You can check the main sources and calculations in this briefing for yourself.
Data Blurbs
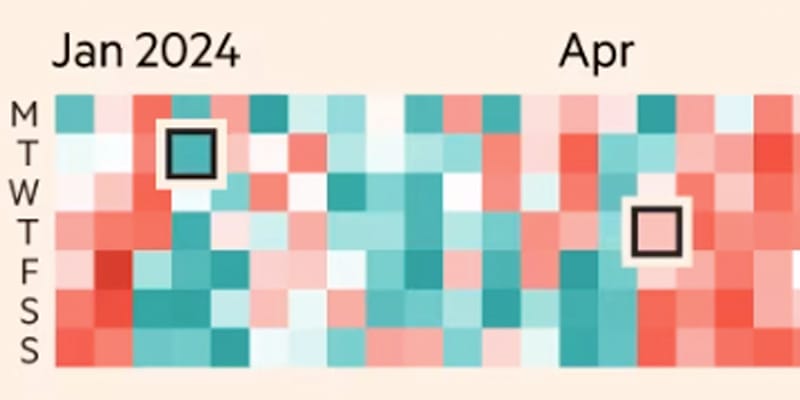
In Europe's cloud capital, data centres devour more than a fifth of the country's electricity. Big Tech insists its energy use is 'matched' by renewables. In practice, servers run on the local grid, which is still mainly fuelled by coal and gas. The trick lies in green credits — a controversial investment scheme where companies balance local power use with clean-energy investments anywhere in Europe. This mismatch is repeated wherever 'green' data centres plug into fossil-fuelled grids. (Financial Times)
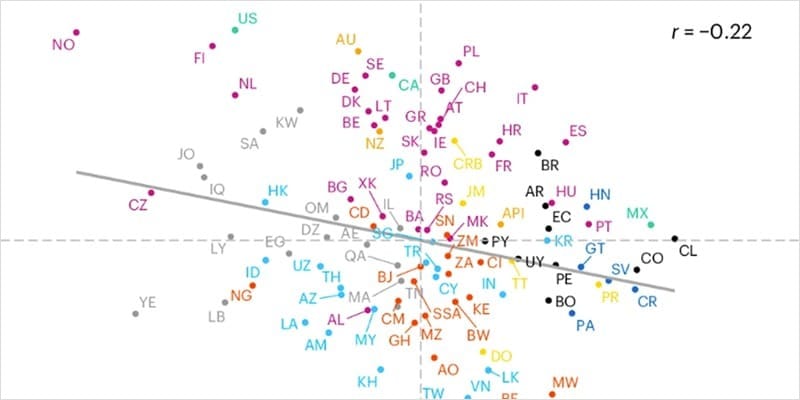
What you believe about climate change depends on where you live. Think of each belief as a node in a network, linked to others. Researchers surveyed 99,074 people across 110 geographic areas. They mapped belief density (the strength of connections between beliefs) and inconsistency (conflict between beliefs) against stance (pro- vs anti-climate). Australia shows high density, low inconsistency and sits in 'stable resistance' — relatively anti-climate attitudes reinforced by tightly interconnected belief systems. (Nature)
Final Thought
Ask 'why' five times about every matter.
- Taiichi Ohno
That's your climate data briefing for this week. Wishing you a productive week ahead.
💛 Juliette and the OnlyFacts team
Data as a Service helps more teams and organisations get an information edge — not just the big players.
*Data note: Annual percentage changes may differ from those reported in official updates due to retrospective revisions. OnlyFacts calculates changes based on published data.