On this page
Good Sunday evening, and welcome to your climate data briefing. I hope you enjoyed a special ANZAC Day and a safe weekend. 🌺
This edition is looong overdue after getting bogged in data mud ... ironic given the topic was four-wheel drives. 🛻
If you're new here, hello and welcome! 👋 You can expect this weekly briefing to arrive every few weeks, hah. 🙃 (We're working on that). The format is 1 x analysis, 2 x quantish reads, and 3 x data updates.
Today's analysis continues a transport emissions deep dive. (It follows part 1, part 2 and part 3).
This time, we're looking at a big datapoint with an unsexy name - average emissions intensity of the light vehicle fleet.
Brum brum! 🏎️
Ps. As usual, you can check the figures and calculations in this briefing here.
Introducing OnlyFacts AI
Our new AI agent can help you find and use our data. It's still in its early stages, but we're sharing the link with some special people – that's you! We'd love you to try it and tell us what you think. (Heads up: you'll need a free login to access it).
Correction 🥲
Thank you to the scrupulous reader who alerted me that the 2005 and 2025 4x4 sales figures in the last briefing were 4x4 and 4x2 sales combined. This didn't affect the analyses about emissions intensity or overall popularity, but did overstate 4x4 sales figures. The original briefing has been updated and the error flagged. The checks and sources are in this briefing's calculations.
Primer on Light Vehicle Emissions Intensity
Let's start with the big picture. There are roughly 20 million light vehicles on Australia's roads.
That includes passenger vehicles (cars and SUVs) and light commercial vehicles (utes and vans) that weigh <3.5 tonnes fully loaded.
They create 13% of Australia’s emissions.
These emissions calculations use tailpipe emissions intensity as an input - grams of carbon dioxide released for every kilometre travelled (g/km).
By tracking the intensity of new vehicles, we can see where emissions are going.
Australians hold onto our cars for a long time, with more than half still registered 19 years later. That means, our decisions today lock in emissions for years to come.
- 2024: Average emissions intensity of vehicles registered for the first time = 156.3 g/km
🤔 What does that mean? A standard red brick weighs roughly 3 kgs. 🧱 At 156.3 g/km, the average vehicle emits a brick's weight in CO₂ every 20 km.
Australia's new vehicles are among the highest emitters in the world. (NTC, 2024)
- +40% higher than Europe
- +5% higher than USA and Canada
That said, the average is falling. Since 2005, it has dropped by more than a third.*
- 2005: 240.9 g/km
- 2024: 156.3 g/km (-35% vs 2005)
*2024 data is based on vehicles first registered, not new car sales, due to new approach taken by National Transport Commission (NTC).
Although intensity has fallen each year, it hasn't been consistent.
The chart below shows percentage change each year.
Notice how:
🟢 Between 2005-2015: it fell steadily
🟠 Between 2016-2020: it more or less plateaued
🟢 From 2021 onwards: it started falling again
These charts represent numerous real-world datapoints (which is why we all ❤️ data viz), including structural shifts in technology and car culture, and millions of individual consumer decisions.
It's these real-world factors we're interested in. Let's take a look.
Terminology note: Past briefings used the word 'cars' for all passenger vehicles, including SUVs. Below, 'cars' refer specifically to sedans, hatchbacks, and station wagons. SUVs are represented and labelled separately.
Big Cars Tank
Twenty years ago, large sedans and station wagons were the darlings of the Australian car market.
In 2005, they had roughly 16% of market share. By 2025, that had withered to just 0.2%.
Sales in 2025:
- Large cars: 2,285 (-99% vs 2005)
- Upper large cars: 348 (-95% vs 2006)
Small Cars Slide
Light, small and medium car sales were more resilient.
These segments grew until 2014, partly thanks to consumers fleeing gas-guzzling large sedans as petrol prices climbed above ... $1 / litre. 😱
But by 2025, their sales had plunged.
Sales in 2025 (vs 2005):
- Light cars: 24,826 (-73%)
- Small cars: 72,222 (-66%)
- Medium cars: 23,175 (-55%)
The chart below shows the small and medium car sales trend. Notice how it fell later than large cars. The timing coincides with the plateau in average emissions intensity. 👀
SUV Nation is Born
The beneficiaries of collapsing car sales were SUVs and utes.
- 2025: SUVs and utes claimed >83% of Australia's new car market.
The chart below shows their explosive growth in the last 20 years – especially SUVs.
(Utes sit within the Light Commercial Vehicle ('LCV') category along with vans, but take the lion's share).
We didn't find sub-segment breakdowns for all SUV sales over the last 20 years. But we do have the makes and models of the top 20, which we mapped to sub-segments on our own (see the calculations doc).
The chart below shows the sub-segment distribution of top-selling SUVs since 2008. It's a bit bumpy because it only reflects the mix within the top 20. If a model dropped out, it isn't included.
Even so, a couple of patterns are clear:
- Medium SUVs are most popular
- Small SUVs hit the top 20 in 2015 – just as small and medium cars were falling
The chart below sums up the overall picture, with the share of total sales for cars, SUVs and LCVs. SUVs are the dominant choice.
Next time, we'll look at the emissions intensity of the vehicles Australians buy, and how that has shaped the curve.
Quantish Reads
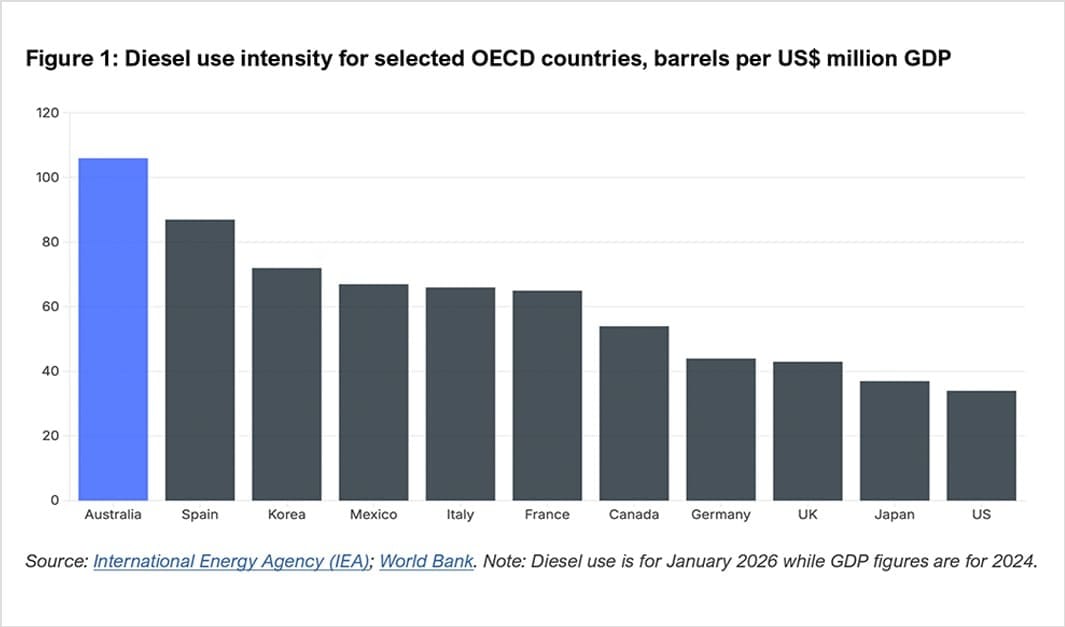
Australia was the world's largest diesel importer in 2025, reportedly buying up to 10% of global seaborne trade - a 'staggering' figure for a country with just 0.3% of the world’s population and 1.6% of GDP. The volumes are driven by high demand and limited domestic production, which meets just 13% of needs. In early April, diesel prices tripled, proving more volatile than crude or petrol. Yet demand is typically inelastic for a non-discretionary fuel. That leaves diesel as a key vulnerability for Australia. (IEEFA)
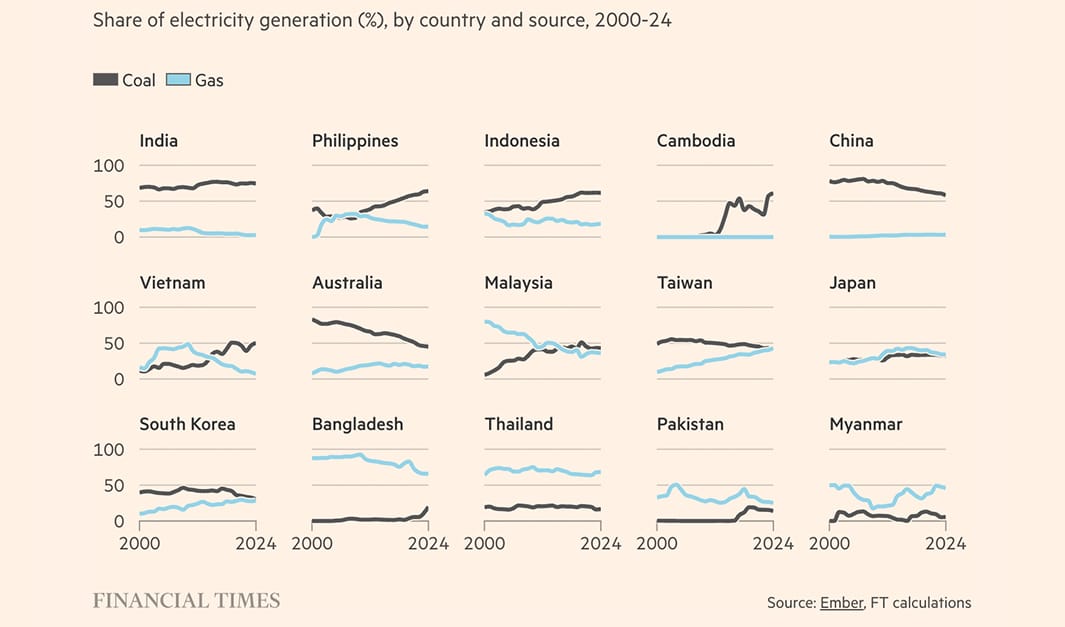
No coal sails through the Strait of Hormuz. That gives it an advantage. At the end of March, the gas prices in Asia had spiked by more than 60 per cent while thermal coal had risen by just 17 per cent, making coal an attractive option for Asian economies. In response, they began firing up coal plants and boosting production. Those countries without large domestic coal supplies have turned to the world’s big coal exporters – Indonesia and Australia. (Financial Times)
Data Updates
🏭 Major facility emissions (Safeguard)
Biggest polluters in FY 2024-25
1️⃣ Gorgon Operations, WA (Operator: Chevron)
- Emissions: 9,021,856 tonnes CO2-e (+2.5% vs 2024)
- Compared to baseline: +5.6% above baseline
- Credits: -478,414 used
2️⃣ Start up and Operations of the Ichthys LNG Project, NT (Operator: Inpex)
- Emissions: 6,255,335 tonnes CO2-e (-6.6% vs 2024)
- Compared to baseline: -1.1% below baseline
- Credits: +67,524 awarded
3️⃣ Port Kembla Steelworks, NSW (Operator: Bluescope Steel)
- Emissions: 6,061,526 tonnes CO2-e (+1.9% vs 2024)
- Compared to baseline: -4.6% below baseline
- Credits: +289,294 awarded
Car sales
Motive power % share in March 2026
- 🥇 Petrol: 33.0% (-3.5 percentage points vs Feb)
- 🥈 Diesel: 27.0% (-2.6 vs Feb)
- 🥉 Hybrid: 17.1% (+1.9 vs Feb)
- EV: 15.1% (+2.9 vs Feb)
- PHEV: 7.8% (+1.4 vs Feb)
Grid renewables
Renewables % share so far in April 2026
- 🥇 NEM: 45.6% (+5.8 percentage points vs April '25)
- 🥈 SWIS: 42.1% (+1.2 vs April '25)
- 🥉 NTESMO: 22.9% (+1.0 vs April '25)
Final Thought
'When the data and the anecdotes disagree, the anecdotes are usually right'.
— Jeff Bezos
That's your climate data briefing. Thank you for reading, and wishing you a great week ahead. We'll be back in your inbox very soon.
💛 Juliette and the OnlyFacts team